
 We Cover Both USA & Canadian
Equities Now!
We Cover Both USA & Canadian
Equities Now!
| |
Home |
About Us & VE Models |
Products & Sign Up |
My Account
|
|
We Cover Both USA & Canadian
Equities Now!
|
|
| STOCK ANALYSIS | PORTFOLIOS | STOCK / ETF REPORTS | BLOGS | |
|
Forbes
Best of The Web
|
Research Findings: Historical Backtests and Actual Traded Performance
Every ValuEngine model, ratings system, benchmark portfolio strategy, and portfolio strategy has been extensively researched and back-tested with historical data from the U.S. equities markets. Where applicable, our models have also been tracked by outside auditors and found to be predictive. Over the long term, the performance of our strategies and newsletters exceeds that of many well-known stock-picking styles. This page illustrates the superior performance of our benchmark portfolio strategies and our proprietary "Engine Rating" system. Below are results from long term backtests using the ValuEngine rating historical data over 20 years. Results do not include any impacts from trading costs or management fees that could reduce returns. Dividend payments are not included, which could increase returns. 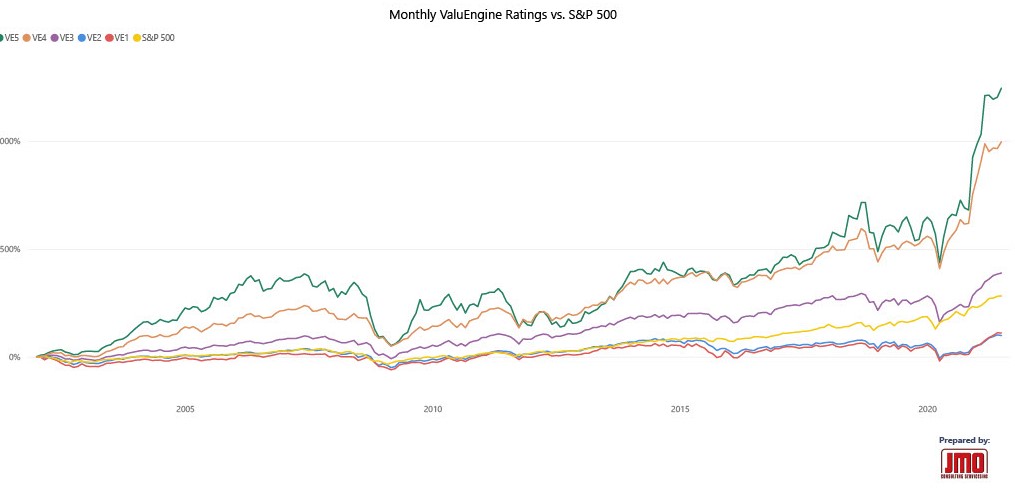
Please note:
Average Annual Return(calculated by averaging each yearly return figure for each individual rating)
Actual traded portfolio performance is available on www.ValuEngineCapital.com Several portfolios based on the ValuEgine stock models are traded in real time and historical performance is posted on this page: valuenginecapital.com/strategies
The Model Test Methodology: Backtesting
ValuEngine currently conducts back tests and performance tracking on US stocks for the period January, 2000 to the present. To maintain the integrity of our research and development process, all of our back tests are conducted under rigorous guidelines designed to eliminate the most common problems that arise when attempting to vet a strategy via the use of historical market data. ValuEngine's back tests eliminate all survivorship, forward-looking, and data-snooping biases. This means that while the tests are conducted in the present, the buy/sell decisions are based solely on data that was contemporary to the time period as well as a historically accurate stock universe. This "out-of-sample" decision rule applies to every investment strategy and/or model we test. For example, when we test a book/market ratio strategy for March, 2008, only the book/market ratio of each stock in March 2008 is used to determine which stocks should be bought or sold during that month. Similarly, the performance of each rating group for March 2010 used only the data available up to that month to estimate the return performance for the ratings. It is the most rigorous and accurate method of backtesting currently available. In other words, no information that later became known is utilized by our models. This rigorous test methodology allows greater confidence in our strategies and helps to ensure that they perform in a variety of market conditions. Annualized return numbers for each rating group are measured as follows: Each year in the backtest is computed by taking the average monthly return of the 12 months in the given year. Each year in the historical time frame is then averaged with the result being an average annual return figure for that rating group. This is repeated for each individual rating group. Actual Traded Performance:
ValuEngine Capital is a separate company created specifically to trade quantitative models for individual and institutional investors. Various portfolios based on the ValuEngine stock models are traded in real time, with actual company and client funds. Actual historical performance of these portfolios is available on www.ValuEngineCapital.com Currently ValuEngine Capital trades the below portfolios:
The historical performance presented on www.ValuEngineCapital.com already deducts any trading costs, management fees, and accounts for dividends. It is the final performance seen, on average, by ValuEngine Capital Management LLC clients. The performance figures come directly from the custodian where the funds are held: Interactive Brokers. ValuEngine Capital has trading authority trade client funds within Interactive Broker accounts, but never has direct access to any funds. ValuEngine Capital is NOT a custodian of funds. All performance provided by Interactive brokers is time weighted. Please click www.interactivebrokers.com for a white paper by Interactive Brokers that outlines the TWR methodology for tracking portfolio performance. Independent Verification of ValuEngine Performance:
Investars.com is an independent company that measures performance of more than a hundred research providers. ValuEngine is listed in their quantitative section. Investars is completely independent of ValuEngine, there is no relationship or exchange of funds other than they track ValuEngine rating performance using their own methodology. Here is a link to ValuEngine performance on Investars: ValuEngine, Inc is not a registered investment adviser. All information presented is for educational purposes only regarding ValuEngine's financial research models and does not intend to make an offer or solicitation for the sale or purchase of any specific securities, investments, or investment strategies. Investments involve risk and unless otherwise stated, are not guaranteed. Past/historical returns do not guarantee future performance. Stock market conditions and the performance of any research effort or model can change at any time. Be sure to first consult with a qualified financial adviser and/or tax professional before implementing any strategy discussed herein. Unless otherwise noted, all historical performance is created from backtests using historical data, not actual traded returns. The methodologies used to backtest ValuEngine data are discussed above. Please contact ValuEngine, Inc for any needed additional information. Contact information is listed below. |

