October 18, 2013
The ValuEngine
Weekly is an Investor Education newsletter focused on the
quantitative approach to investing and the tools available
from ValuEngine.com. In today's fast-moving and globalized financial markets, it is easy to get overloaded with information.
The winners will adopt an objective, scientific,
independent and unemotional approach to investing. If you
are not yet a member of ValuEngine's stock analysis service,
sign up now for a free trial at www.valuengine.com!
If the tables, charts, or other content in this email version of the newsletter do not display properly, please download the HTML version from
ValuEngine.com HERE or the PDF version from SCRIBD.com HERE
If you no longer wish to receive this free newsletter,
CLICK HERE to unsubscribe |
VALUATION WARNING: Our models find that overvaluation is at levels typically seen when market pullbacks occur. Overvalued stocks now make up 77.72% of our stocks assigned a valuation and 44.61% of those equities are calculated to be overvalued by 20% or more. 15 of 16 sectors are calculated to be overvalued--14 of them by double digits.
ValuEngine Index Overview
|
|
|
|
|
|
DJIA |
15231.33 |
15,371.65 |
140.32 |
0.92% |
17.14% |
NASDAQ |
3767.49 |
3,863.15 |
95.66 |
2.54% |
28.95% |
RUSSELL 2000 |
1078.73 |
1,102.27 |
23.54 |
2.18% |
30.40% |
S&P 500 |
1699.86 |
1,733.15 |
33.29 |
1.96% |
21.83% |
ValuEngine Market Overview
Summary of VE Stock Universe |
Stocks Undervalued |
22.28% |
Stocks Overvalued |
77.72% |
Stocks Undervalued by 20% |
8.96% |
Stocks Overvalued by 20% |
44.61% |
ValuEngine Sector Overview
|
|
|
|
|
|
|
Retail-Wholesale |
0.46% |
0.96% |
35.21% |
26.53% overvalued |
35.57% |
23.83 |
Auto-Tires-Trucks |
0.39% |
0.91% |
50.12% |
26.28% overvalued |
48.05% |
21.18 |
Transportation |
0.69% |
3.08% |
31.89% |
24.84% overvalued |
34.51% |
19.71 |
Business Services |
0.63% |
2.08% |
29.38% |
24.39% overvalued |
31.57% |
24.90 |
Computer and Technology |
0.77% |
4.20% |
40.40% |
24.36% overvalued |
31.01% |
30.61 |
Consumer Discretionary |
0.53% |
1.47% |
36.01% |
23.70% overvalued |
33.23% |
26.32 |
Medical |
0.98% |
2.72% |
39.05% |
22.24% overvalued |
26.60% |
27.20 |
Industrial Products |
0.52% |
2.03% |
34.94% |
21.39% overvalued |
37.46% |
22.67 |
Aerospace |
0.47% |
2.63% |
34.10% |
21.05% overvalued |
36.87% |
16.69 |
Finance |
0.75% |
2.81% |
25.20% |
19.93% overvalued |
15.06% |
17.74 |
Multi-Sector Conglomerates |
0.68% |
2.35% |
13.50% |
19.39% overvalued |
15.81% |
19.01 |
Consumer Staples |
0.99% |
4.88% |
24.92% |
18.01% overvalued |
21.88% |
23.16 |
Construction |
1.13% |
4.15% |
36.93% |
14.10% overvalued |
33.09% |
26.11 |
Oils-Energy |
1.04% |
4.42% |
27.07% |
10.16% overvalued |
11.75% |
26.54 |
Utilities |
1.31% |
3.35% |
19.26% |
9.58% overvalued |
9.91% |
20.66 |
Basic Materials |
1.34% |
1.73% |
8.20% |
5.42% undervalued |
-27.61% |
20.10 |
ValuEngine Newsletters Latest Results
VE Newsletter |
Current Results |
S&P 500 |
Last Month Total |
S&P 500 |
Since Inception |
S&P 500 |
|
-0.11 |
0.67 |
4.08 |
1.99 |
112.65 |
88.45 |
|
1.21 |
2.39 |
3.89 |
2.16 |
7.46 |
9.04 |
|
6.31 |
2.1 |
1.84 |
3.32 |
32.25 |
22.39 |
|
6.56 |
2.09 |
2.87 |
2.74 |
85.63 |
53.04 |
ValuEngine's Newsletters Beat the Market
With our Investment Newsletters, Subscribers Harness the Power of all of ValuEngine.com's Extensively Tracked and Tested Portfolio Strategies in an Easy to Follow Format.
Let ValuEngine Optimize your Portfolio and Provide Rational Advice for Smarter Investing
Click HERE to Check Out ValuEngine's Investment Newsletters
Free Download for Readers
As a bonus to our Free Weekly Newsletter subscribers, we are offering a FREE DOWNLOAD of one of our Detailed Stock Valuation Reports--this report is normally $25.00
This week's free download is for Google (GOOG). Google Inc. is a technology company that provides a web based search engine through its website. The Company offers a wide range of search options, including web, image, groups, directory, and news searches. It serves corporate clients, including advertisers, content publishers and site managers with cost-effective advertising and a wide range of revenue generating search services. Google Inc. is headquartered in Mountain View, California.
ValuEngine continues its HOLD recommendation on GOOGLE INC-CL A for 2013-10-17. Based on the information we have gathered and our resulting research, we feel that GOOGLE INC-CL A has the probability to ROUGHLY MATCH average market performance for the next year. The company exhibits ATTRACTIVE Company Size but UNATTRACTIVE Price Sales Ratio.
Read our Complete Detailed Valuation Report on Google HERE.
Sector Talk--Basic Materials
Below, we present the latest data on Basic Materials stocks from our Institutional software package (VEI). Top five lists are provided for each category. We applied some basic liquidity criteria--share price greater than $3 and average daily volume in excess of 100k shares.
Please Click Here to Download a FREE Demo of ValuEngine's Professional VEI Software Package.
Top-Five Basic Materials Stocks--Short-Term Forecast Returns
Ticker |
Name |
Mkt Price |
Valuation(%) |
Last 12-M Retn(%) |
DQ |
DAQO NEW ENERGY |
32.91 |
N/A |
701.02 |
SLCA |
US SILICA HOLDI |
34.49 |
-7.07 |
155.29 |
SID |
CIA SIDERUR-ADR |
5.46 |
69.01 |
-4.21 |
FOE |
FERRO CORP |
10.19 |
30.32 |
265.23 |
TC |
THOMPSON CREEK |
3.25 |
17.38 |
14.04 |
Top-Five Basic Materials Stocks--Long-Term Forecast Returns
Ticker |
Name |
Mkt Price |
Valuation(%) |
Last 12-M Retn(%) |
DQ |
DAQO NEW ENERGY |
32.91 |
N/A |
701.02 |
SLCA |
US SILICA HOLDI |
34.49 |
-7.07 |
155.29 |
SID |
CIA SIDERUR-ADR |
5.46 |
69.01 |
-4.21 |
FOE |
FERRO CORP |
10.19 |
30.32 |
265.23 |
TC |
THOMPSON CREEK |
3.25 |
17.38 |
14.04 |
Top-Five Basic Materials Stocks--Composite Score
Ticker |
Name |
Mkt Price |
Valuation(%) |
Last 12-M Retn(%) |
SLCA |
US SILICA HOLDI |
34.49 |
-7.07 |
155.29 |
KGC |
KINROSS GOLD |
4.88 |
-63.11 |
-53.21 |
RKT |
ROCK-TENN CO |
108.04 |
5.26 |
42.7 |
ADM |
ARCHER DANIELS |
37.9 |
-1.01 |
30.24 |
WLK |
WESTLAKE CHEM |
110.77 |
8.1 |
42.63 |
Top-Five Basic Materials Stocks--Most Overvalued
Ticker |
Name |
Mkt Price |
Valuation(%) |
Last 12-M Retn(%) |
BHP |
BHP BILLITN LTD |
69.18 |
253.4 |
-2.8 |
CHMT |
CHEMTURA CORP |
24.27 |
96.9 |
49.26 |
BZ |
BOISE INC |
12.6 |
95.05 |
40.63 |
ZOLT |
ZOLTEK COS INC |
16.71 |
71.25 |
120.16 |
SID |
CIA SIDERUR-ADR |
5.46 |
69.01 |
-4.21 |
Find out what Wall Street Investment and Media Professionals already know,
ValuEngine offers sophisticated stock valuation and forecast research as well as a variety of portfolio screening and creation tools.
What's Hot-- US Government Shutdown has Limited Effect on Market
Direct economic effects attributed to the shutdown are relatively minor. As IMF Monetary and Capital Markets Department Assistant Director Laura Kodres recently noted, "the shutdown so far has been fairly benign. The effects on the markets have been relatively low."
As is typical, markets had already priced in the potential shutdown. So, fluctuations in equities have been within recent norms. However, the IMF's Kodres also cautioned that the shenanigans in Washington DC could have a negative impact on the US economy if they lead to greater uncertainty. "Any time we have an increase in uncertainty, that can have an effect on demand and potentially the supply of credit.”
Economists who have tried to quantify the effect of a short-term government shutdown have predicted only minor effects on the US economy. Typically, their estimates indicate that growth would only suffer a decline of a few tenths of a percent for the fourth quarter. These low estimates are predicated on a shutdown similar to those which have occurred in the past. The typical US shutdown has only endured for a few days to a few weeks and their effects were largely benign for investors. For the most recent US government shutdown during the Clinton Administration--and there were actually two periods where the government was “shutdown,” November 13-19, 1995 and December 6, 1995-January 6, 1996, the total duration was 27 days.
The effect of the Clinton-era shutdown on the stock market was minor. But the mid-90s economy featured a much lower overall unemployment rate as the US was benefiting from the post-Cold War “peace dividend” and a technology boom which would culminate in a roaring stock market only brought to heel by the bursting of the tech bubble.
If we consider the market effects of all of the US government shutdowns dating back to the Carter Administration—17 in all, we find that in almost every case the market may have suffered a temporary setback, but went on to post positive gains within a few weeks or months—shutdowns during the Carter Administration are the exception to this rule due the additional economic issues of that era (inflation, high unemployment, oil shocks, etc.) For all US government shutdowns since 1981—eleven total, within 30 days the market was higher than pre-shutdown levels on nine occasions.
Thus we find that the overall economic picture combined with the historical lessons of past shutdowns should be bullish for stocks. Current debt levels are a drag on growth to be sure, but they do not threaten the short-term economic growth of the US economy. Despite the economic crisis of 2007-2008--and the resultant surge in debt necessitated by the various bailouts and stimulus programs, inflation remains low and is predicted to remain at @1.86%/year for the next decade according to the Federal Reserve Bank of Cleveland's latest survey of economists and market measures. Because the world still believes in the “full faith and credit” of the US government, current interest rates remain at 40-year lows.
The generally positive market, interest-rate, and overall economic environment makes it all the more disappointing that politicians in Washington DC are playing such a dangerous game. Their continued failure to cut a budget deal is putting the global economic leadership of the US at risk. Nobody can know for sure what would happen to the global economy if the U.S. were to miss an interest payment or miss a payoff on a maturing note or bond. Rates on short-term Treasuries spiked 0.06% last week as nervous investors considered the possibility of a default. In addition, the cost of credit default swaps on US debt almost doubled.
Since 1960, Congress has raised this limit 78 times without much controversy and over the course of that half century not a single Social Security check has been missed, nor has a senior citizen lost their medicare. No default has ever occurred. However, in 2011, a delay in raising the debt ceiling caused a rating agency to downgrade the U.S. debt for the first time ever --and subsequently cost the US billions in increased borrowing costs. In 1979, a Treasury Department paperwork “glitch” related to a last minute debt-ceiling increase resulted in an interest rate increase of 0.6% and also cost taxpayers billions of dollars.
We have seen sideways trading in treasuries, but fortunately the equity markets have been relatively stable. The stock market continues to benefit from the Federal Reserve's policy of “quantitative easing” with resultant 0% to 0.25% federal-funds rate. If confirmed, new Fed Chief nominee Janet Yellen will most likely continue this policy over the next year. Yellen also has re-emphasized the Fed's employment mandate, and one would expect some further assistance to the labor market—which would increase government revenues and provide the final piece of the puzzle needed for a full US economic recovery.
We remain convinced that the US economy has weathered the Great Recession of 2008 and overcome the lion's share of issues related to the financial system and the housing market. While the labor market remains a concern, we have confidence in the new Fed Chair nominee's experience and judgment and believe that she will continue policies which have been of great benefit to the equity markets. The potential for a “relief rally” is significant and investors could benefit--just as they did after a majority of the shutdowns since 1981.
ValuEngine View Continues to Dominate S&P 500
For September/October, the stock market was on a debt-crisis roller coaster which finally broke to the upside once the politicians in
Washington DC came to their senses. Our portfolio however, turned in another winning performance. The ValuEngine View posted a gain of 6.56% vs. the S&P 500 gain of 2.09%. That's a beat of 447 bps. The trailing 12 month gain of the VE View is 49.76% versus the S&P 500 return of 19.04%. The return since inception of the View is 85.63% versus the S&P's gain of 53.04%.
Nine of our fifteen picks were winners with impressive double-digit gains posted by US Silica, Sunpower, Changyou, CTC Media, Icahn
Enterprises, and Scorpio Tankers. Sunpower and US Silica have been on a tear the past few months for the View. However, our portfolio was held back by the losses posted by Cooper Tire and Popular Inc.
Return Comparison vs. S&P 500 |
|
Last 12 Months |
VE View |
49.76% |
S&P 500 |
19.04% |
Thank goodness the “adults” in Washington DC held sway and the shutdown and potential debt default shenanigans of the Tea Party faction of Congress was put to rest—for now. The markets jumped up in relief on several occasions during the past month and we believe that if the US economy can avoid these sorts of self-inflicted wounds moving forward and get the labor situation improved, the recovery will finally take off.
With the ValuEngine View Newsletter you Receive 20 Carefully Selected Stock Picks which Represent the Most Up-to-Date Calculations of our Award-Winning Stock Valuation and Forecast Models
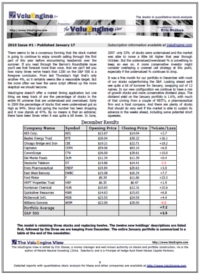
Here are the results for September-October 2013:
|
|
|
|
|
|
ALR |
ALERE INC |
32.19 |
31.64 |
-0.55 |
-1.71 |
BPOP |
POPULAR INC |
29.2 |
25.41 |
-3.79 |
-12.98 |
CSTE |
CAESAR STONE SD |
41.59 |
39.49 |
-2.10 |
-5.05 |
CTB |
COOPER TIRE |
32.26 |
25.51 |
-6.75 |
-20.92 |
CTCM |
CTC MEDIA INC |
10.8 |
12.3 |
1.50 |
13.89 |
CYOU |
CHANGYOU |
31.37 |
36.96 |
5.59 |
17.82 |
HPQ |
HEWLETT PACKARD |
21.74 |
23.39 |
1.65 |
7.59 |
IEP |
ICAHN ENTERPRISES |
78.01 |
87.61 |
9.60 |
12.31 |
SLCA |
US SILICA HOLDINGS |
25.12 |
34.49 |
9.37 |
37.30 |
SNTS |
SANTARUS INC |
22.15 |
23.2 |
1.05 |
4.74 |
SPLS |
STAPLES INC |
14.64 |
15.61 |
0.97 |
6.63 |
SPWR |
SUNPOWER CORP-A |
24.41 |
31.59 |
7.18 |
29.41 |
STNG |
SCORPIO TANKERS |
9.84 |
10.9 |
1.06 |
10.77 |
TEO |
TELECOM ARGENTINA |
19.44 |
19.28 |
-0.16 |
-0.82 |
WLP |
WELLPOINT INC |
89.1 |
88.59 |
-0.51 |
-0.57 |
|
VALUENGINE VIEW PORTFOLIO |
|
|
|
6.56 |
GSPC |
S&P500 |
1697.6 |
1733.15 |
35.55 |
2.09 |

Looking for a monthly portfolio of stock picks which are objective and based on cutting-edge academic theory and Wall St.practice? Then subscribe to The ValuEngine View Newsletter.The ValuEngine View Portfolio is based on our highly-refined and tested ValuEngine Portfolio Strategies along with our proprietary quant-based composite scoring system. The ValuEngine View Newsletter is the product of sophisticated stock valuation and forecast models first developed by Yale Professor of Finance Zhiwu Chen.
VE View vs. S&P 500 Index Since Launch |
|
VE View |
S&P 500 |
Ann Return |
12.42% |
6.65% |
Ann Volatility |
29.91% |
17.42% |
Sharpe Ratio |
0.42 |
0.38 |
Sortino Ratio |
0.46 |
0.42 |
Max Drawdown |
-72.02% |
-51.35% |
The ValuEngine View Newsletter is derived from the ValuEngine Aggressive and Diversified Growth Benchmark Portfolio Strategies. These strategies are the product of ValuEngine's academic research team and combine cutting-edge financial analysis and portfolio construction techniques with real-world Wall St. know how.
The ValuEngine View Newsletter portfolio has 15 primary stock picks and five alternates and is re-balanced once each month. The ValuEngine View Newsletter is published near the middle of each calendar month. An equal amount of capital is allocated to each stock. The monthly returns are calculated from the closing prices on date of publication. The performance calculation does not include any transaction costs.
Sign up now and you can access the current portfolio and you will receive next month's rebalanced portfolio as well!
Click HERE or on the Logo Below to Sign Up for the ValuEngine View Newsletter

Suttmeier Says
--Commentary and Analysis from Chief Market Strategist Richard Suttmeier
If you have any comments or questions, send them to Rsuttmeier@Gmail.com
Treasury Yields
10-Year--(2.594) Daily and semiannual value levels are 2.662 and 3.227 with a monthly pivot at 2.603, and annual and semiannual risky levels at 2.476, 1.981 and 1.719.
Commodities and Forex
Comex Gold –($1318.7) Daily and monthly value levels are $1267.9 and $1145.2 with quarterly and annual risky levels at $1435.6, $1599.9 and $1852.1.
Nymex Crude Oil – ($100.65) My monthly value level is $99.84 with a daily pivot at $100.55, and semiannual, quarterly and annual risky levels at $109.84, $114.36 and $115.23.
The Euro – (1.3675) Annual, quarterly, monthly and semiannual value levels are 1.3257, 1.2805, 1.2782, 1.2756 and 1.2477 with a daily pivot at 1.3558 and annual risky level at 1.4295.
Major Indices
Daily Dow: (115,372) Semiannual and annual value levels are 14,724 and 12,696 with a daily risky level
at 15,404, the Sept. 18 all time high at 15,709.59, and monthly, semiannual and quarterly risky levels at
15,932, 16,490 and 16,775.
S&P 500 – (1733.2) Daily, semiannual and annual value levels are 1723.9, 1606.9, 1400.7 and 1348.3
with the Oct. 17 all time high at 1733.45, and semiannual, monthly and quarterly risky levels at 1743.5,
1746.4 and 1853.8.
NASDAQ – (3863) Annual, semiannual and annual value levels are 3759, 3668 and 2806 with a
monthly pivot at 3830, the Oct. 17 multi-year high at 3863.49, and quarterly risky level at 4025.
NASDAQ 100 (NDX) – (3301) Daily, monthly and annual value levels are 3257, 3254 and 2463 with a
semiannual pivot at 3304, the Oct. 17 multi-year high at 3304.00, and quarterly risky levels at 3477.
Dow Transports – (6748) Daily and annual value levels are 6728, 5925 and 5469 with the Sept. 20 all
time high at 6754.81, and monthly, semiannual and quarterly risky levels at 6811, 7104 and 7205.
Russell 2000 – (1102.27) Daily and annual value levels are 1091.44, 860.25 and 809.54 with a
semiannual and monthly pivots at 1089.42 and 1092.46, the Oct. 17 all time high at 1102.27, and
quarterly risky level at 1163.21.
The SOX – (505.09) Daily and annual value levels are 499.36 and 338.03 with the Oct. 17 high at
505.41, and monthly, quarterly and semiannual risky level at 512.13, 514.87 and 533.56.
Dow Utilities: (494.61) My semiannual value level is 481.92 with daily, monthly, quarterly, semiannual
and annual risky levels at 498.48, 512.80, 520.55, 523.33 and 540.37.
Stock of the Day
One of the more popular features of Richard Suttmeier's Morning Briefing for investors is his stock of the day. In every issue, Suttmeier highlights one stock and provides VE data as well as his own proprietary technical data.
Here is today's stock of the day from Richard Suttmeier's Morning Briefing Newsletter.
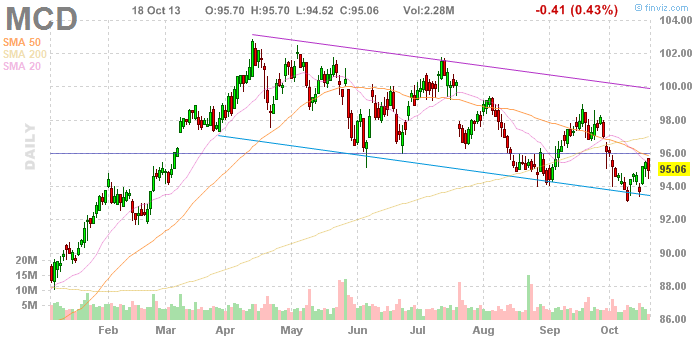
McDonalds (MCD) – ($95.40)McDonald's Corporation develops, operates, franchises and services a worldwide system of restaurants that prepare, assemble, package and sell a limited menu of value-priced foods. The company operates primarily in the quick-service hamburger restaurant business. All restaurants are operated by the company or, under the terms of franchise arrangements, by franchisees who are independent third parties, or by affiliates operating under joint-venture agreements between the company and local business people.
Analysis – McDonalds has a buy rating according to ValuEngine with fair value at $91.92, which makes the stock 3.6% overvalued. The ValuEngine one-year price target is $103.82.The daily chart for McDonalds shows rising momentum with the stock below its 21-day, 50- day and 200-day simple moving averages at $95.69, $95.97 and 97.51. My weekly value level is $73.89 with a semiannual pivot at $74.96 and monthly risky level at $79.27.

Richard Suttmeier, Chief Market Strategist at ValuEngine.com & Contributor to TheStreet.com
Richard Suttmeier has been a professional in the US Capital Markets since 1972 transferring his engineering skills to the trading and investment world. He earned a Bachelor of Industrial Engineering degree from Georgia Institute of Technology in 1966, and a Master of Science, Operations Research, Systems Analysis degree from Brooklyn Polytechnic University in 1970. Over the years Richard appeared many times in the financial media, on networks such as CNBC, CNN, CNNfn, New York 1, Bloomberg TV and radio, Fox Business, Business News Network in Canada, Wall Street Week with Fortune, Yahoo Finance Breakout, and the Bill Mazer Radio Show. In 2002, he anchored his own show on Yahoo Finance Vision called, "Traders' Club with Richard Suttmeier." Richard has been frequently quoted in USA Today, The NY Times, Wall Street Journal, Reuters, and The Dow Jones Newswires. Richard has made numerous speaking appearances in recent years to groups such as the Market Technicians Associations, the American Association of Individual Investors, Wells Fargo Advisors, the Executive Forum at the National Arts Club, and the Investors Roundtable of Wilmington NC.
Now YOU can take advantage of the same market and trading expertise as the financial media with Richard Suttmeier's ValuTrader Model Portfolio
The ValuTrader Portfolio Newsletter is based on ValuEngine Chief Market Strategist Richard Suttmeier's proprietary market analytics. Suttmeier combines his technical analysis expertise with ValuEngine's proprietary valuation, forecast, and ratings data for more than 4000 equities trading on US markets to come up with a 20 stock portfolio tailored to current market conditions. With ValuTrader, subscribers access Suttmeier's "Buy and Trade" strategy with a portfolio designed to function well in both up and down markets.
With Richard Suttmeier's Morning Briefing, you get daily analysis of US Treasury Yields, Gold, Crude Oil, and Currency Exchange Rates--Dollar, Yen, Pound, and Euro--as well as key technical indicators for the major equity averages. |
|
 |

If you no longer wish to receive this free newsletter, CLICK HERE to unsubscribe
|