
December 15, 2017
This week, we provide top-five ranked VE data for our Business Services Sector stocks. We take a look at our latest data on Twitter $TWTR and provide a free download link for our stock report on the company. We have rescinded our latest Valuation Watch.
ValuEngine Market Overview
ValuEngine Sector Overview
|
|||||||||||||||||||||||||||||||||||||||||||||||||||||||||||||||||||||||||||||||||||||||||||||||||||||||||||||||||||||||||||||||||||||||||||||||||||||||||||||||||||||||||||||||||||||||||||||||||||||||||||||||||||||||||||||||||||||||||||||||||||||||||||||||||||||||||||||||||||||||||||||||||||||||||||||||||||||||||||||||||||||||||||||||||||||||||||||||||||||||||||||||||||

Ticker |
Name |
Mkt Price |
Valuation (%) |
Last 12-M Return (%) |
RRD |
DONNELLEY (RR) |
8.83 |
N/A |
-46.65% |
KELYA |
KELLY SVCS A |
27.32 |
25.07% |
19.88% |
LAMR |
LAMAR ADVER CO |
78.39 |
14.92% |
16.18% |
KFY |
KORN/FERRY INTL |
40.38 |
19.19% |
38.15% |
AHEXY |
ADECCO SA U-ADR |
37.44 |
N/A |
15.57% |
Top-Five Business Services Stocks--Momentum
Ticker |
Name |
Mkt Price |
Valuation (%) |
Last 12-M Return (%) |
GDOT |
GREEN DOT CP-A |
59.24 |
34.78% |
137.82% |
BCO |
BRINKS CO THE |
79.15 |
2.77% |
87.78% |
RCM |
R1 RCM INC |
4.27 |
26.14% |
84.85% |
TRU |
TRANSUNION |
55.39 |
N/A |
79.84% |
TNET |
TRINET GROUP |
43.13 |
3.80% |
78.59% |
Top-Five Business Services Stocks--Composite Score
Ticker |
Name |
Mkt Price |
Valuation (%) |
Last 12-M Return (%) |
FDC |
FIRST DATA CORP |
16.26 |
-37.26% |
14.43% |
ATTO |
ATENTO SA |
9.9 |
-2.61% |
40.43% |
MAN |
MANPOWER INC WI |
122.6 |
2.54% |
35.39% |
ADS |
ALLIANCE DATA |
236.29 |
-14.79% |
2.74% |
WU |
WESTERN UNION |
19.35 |
-8.73% |
-10.17% |
Top-Five Business Services Stocks--Most Overvalued
Ticker |
Name |
Mkt Price |
Valuation (%) |
Last 12-M Return (%) |
HRI |
HERC HOLDINGS |
63.3 |
77.66% |
62.64% |
ROL |
ROLLINS INC |
45.7 |
37.73% |
37.69% |
GDOT |
GREEN DOT CP-A |
59.24 |
34.78% |
137.82% |
ASGN |
ON ASSIGNMENT |
62.18 |
32.19% |
41.03% |
WNS |
WNS HLDGS-ADR |
40.16 |
29.80% |
51.09% |
Free Download for Readers
As a bonus to our Free Weekly Newsletter subscribers,
we are offering a FREE DOWNLOAD of one of our Stock Reports
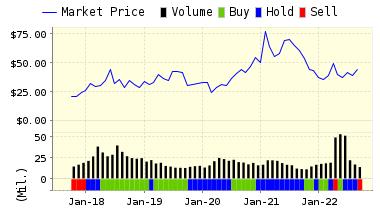
Twitter, Inc. (TWTR) operates as a global platform for public self-expression and conversation in real time. The company offers various products and services, including Twitter that allows users to create, distribute, and discover content; and Periscope, a mobile application that enables user to broadcast and watch video live with others. It also provides promoted products and services, such as promoted tweets, promoted accounts, and promoted trends, which enable its advertisers to promote their brands, products, and services. In addition, the company offers a set of tools, public APIs, and embeddable widgets for developers to contribute their content to its platform, and syndicate and distribute Twitter content across their properties and enhance their Websites and applications with Twitter content. Further, it provides subscription access to its public data feed for data partners. The company was founded in 2006 and is headquartered in San Francisco, California.
VALUENGINE RECOMMENDATION: ValuEngine continues its SELL recommendation on TWITTER INC for 2017-12-14. Based on the information we have gathered and our resulting research, we feel that TWITTER INC has the probability to UNDERPERFORM average market performance for the next year. The company exhibits UNATTRACTIVE Price Sales Ratio and Sharpe Ratio.
You can download a free copy of detailed report on Twitter (TWTR) from the link below.
Read our Complete Rating and Forecast Report HERE.
ValuEngine Forecast |
||
Target Price* |
Expected Return |
|
|---|---|---|
1-Month |
22.45 | -0.55% |
3-Month |
21.91 | -2.90% |
6-Month |
21.63 | -4.15% |
1-Year |
21.09 | -6.56% |
2-Year |
18.04 | -20.08% |
3-Year |
15.58 | -30.96% |
Valuation & Rankings |
|||
Valuation |
16.53% undervalued | Valuation Rank(?) | |
1-M Forecast Return |
-0.55% | 1-M Forecast Return Rank | |
12-M Return |
19.23% | Momentum Rank(?) | |
Sharpe Ratio |
-0.35 | Sharpe Ratio Rank(?) | |
5-Y Avg Annual Return |
-17.58% | 5-Y Avg Annual Rtn Rank | |
Volatility |
50.61% | Volatility Rank(?) | |
Expected EPS Growth |
516.67% | EPS Growth Rank(?) | |
Market Cap (billions) |
14.32 | Size Rank | |
Trailing P/E Ratio |
n/a | Trailing P/E Rank(?) | |
Forward P/E Ratio |
270.84 | Forward P/E Ratio Rank | |
PEG Ratio |
2.18 | PEG Ratio Rank | |
Price/Sales |
5.90 | Price/Sales Rank(?) | |
Market/Book |
3.99 | Market/Book Rank(?) | |
Beta |
1.10 | Beta Rank | |
Alpha |
-0.10 | Alpha Rank | |
Contact ValuEngine at (800) 381-5576 or support@valuengine.com
Visit www.ValuEngine.com for more information
Contact ValuEngine Capital at info@valuenginecapital.com
Visit www.ValuEngineCapital.com for more information

If you no longer wish to receive this free newsletter, CLICK HERE to unsubscribe
