
August 17, 2018
EDITOR'S NOTE: We will be on a limited publication schedule later this month. Bulletins will be reduced the weeks of August 20-24 (we will publish M-W) and September 3-7 (we will publish W-F). There will be no bulletins the week of August 27-31. We will return to our normal publication schedule the week of September 10th.
|
||||||||||||||||||||||||||||||||||||||||||||||||||||||||||||||||||||||||||||||||||||||||||||||||||||||||||||||||||||||||||||||||||||||||||||||||||||||||||||||||||||||||||||||||||||||||||||||||||||||||||||||||||||||||||||||||||||||||||||||||||||||||||||||||||||||||||||||||||||||||||||||||||||||||||||||||||||||||||||||||||||||||||||||||||||||||||||||||||||||||||||||||||

Index
|
Week Open
|
Friday PM
|
Change
|
% Change
|
YTD
|
DJIA |
25327.19 |
25683.97 |
356.78 |
1.41% |
3.90% |
NASDAQ |
7848.00 |
7818.44 |
-29.56 |
-0.38% |
13.26% |
RUSSELL 2000 |
1686.81 |
1692.22 |
5.41 |
0.32% |
10.21% |
S&P 500 |
2835.46 |
2851.46 |
16.00 |
0.56% |
6.65% |
ValuEngine Market Overview
Summary of VE Stock Universe |
|
Stocks Undervalued |
50.09% |
Stocks Overvalued |
49.91% |
Stocks Undervalued by 20% |
20.51% |
Stocks Overvalued by 20% |
20.27% |
ValuEngine Sector Overview
Sector
|
Change
|
MTD
|
YTD
|
Valuation
|
Last 12-MReturn
|
P/E Ratio
|
0.48% |
1.08% |
7.38% |
13.65% overvalued |
26.28% |
31.61 |
|
0.54% |
-1.49% |
6.97% |
13.15% overvalued |
18.17% |
26.45 |
|
0.82% |
-0.05% |
14.57% |
11.00% overvalued |
42.76% |
29.82 |
|
-0.08% |
-0.63% |
5.06% |
9.55% overvalued |
29.37% |
24.63 |
|
0.71% |
0.81% |
10.86% |
9.00% overvalued |
22.58% |
24.74 |
|
0.54% |
-2.00% |
-2.96% |
6.81% overvalued |
6.35% |
20.18 |
|
0.56% |
-1.13% |
-1.74% |
5.46% overvalued |
10.25% |
24.57 |
|
0.35% |
-0.23% |
2.92% |
5.17% overvalued |
17.71% |
26.86 |
|
1.15% |
1.45% |
-3.18% |
4.96% overvalued |
-3.47% |
19.94 |
|
0.62% |
0.02% |
2.39% |
2.97% overvalued |
7.74% |
17.92 |
|
0.61% |
-1.10% |
-3.82% |
2.26% overvalued |
3.97% |
12.67 |
|
0.62% |
-1.39% |
-1.60% |
0.49% undervalued |
13.01% |
18.69 |
|
0.66% |
-0.97% |
2.64% |
0.67% undervalued |
17.74% |
24.31 |
|
1.16% |
-2.19% |
-0.41% |
5.90% undervalued |
15.28% |
20.95 |
|
0.28% |
-4.81% |
0.48% |
13.79% undervalued |
-3.62% |
19.86 |
|
0.62% |
-3.42% |
4.90% |
15.37% undervalued |
18.96% |
23.05 |
Want to learn more about ValuEngine? Our methods? Our history?
Check out our video presentation HERE
Sector Talk--Business Services
Below, we present the latest data on Business Services
stocks from our Professional Stock Analysis Service. Top-
five lists are provided for each category. We applied some basic
liquidity criteria--share price greater than $3 and average daily
volume in excess of 100k shares.
Top-Five Business Services Stocks--Short-Term Forecast Returns
Ticker |
Name |
Mkt Price |
Valuation (%) |
Last 12-M Return (%) |
| RCM | R1 RCM INC | 8.75 | 147.97% | 171.74% |
| TISI | TEAM INC | 24.25 | 45.87% | 118.47% |
| GDOT | GREEN DOT CP-A | 84.75 | 49.01% | 80.51% |
| SPSC | SPS COMMERCE | 93.72 | 34.83% | 60.04% |
| RHI | ROBT HALF INTL | 78.09 | 47.26% | 78.12% |
Top-Five Business Services Stocks--Momentum
Ticker |
Name |
Mkt Price |
Valuation (%) |
Last 12-M Return (%) |
| GDS | GDS HOLDINGS | 30.94 | N/A | 238.88% |
| SSTI | SHOTSPOTTER INC | 39.14 | N/A | 223.20% |
| NEWA | NEWATER TECHNLG | 25.06 | N/A | 172.69% |
| RCM | R1 RCM INC | 8.75 | 147.97% | 171.74% |
| NSP | INSPERITY INC | 112.1 | 10.30% | 170.28% |
Top-Five Business Services Stocks--Composite Score
Ticker |
Name |
Mkt Price |
Valuation (%) |
Last 12-M Return (%) |
| FCN | FTI CONSULTING | 77.1 | 12.39% | 135.42% |
| MA | MASTERCARD INC | 203.6 | 12.09% | 53.81% |
| CPRT | COPART INC | 60.82 | 6.34% | 88.71% |
| WEX | WEX INC | 182.44 | 10.38% | 75.83% |
| SPGI | S&P GLOBAL INC | 202.69 | 9.58% | 33.11% |
Top-Five Business Services Stocks--Most Overvalued
Ticker |
Name |
Mkt Price |
Valuation (%) |
Last 12-M Return (%) |
| RCM | R1 RCM INC | 8.75 | 147.97% | 171.74% |
| GDOT | GREEN DOT CP-A | 84.75 | 49.01% | 80.51% |
| RHI | ROBT HALF INTL | 78.09 | 47.26% | 78.12% |
| WNS | WNS HLDGS-ADR | 51.45 | 46.15% | 46.79% |
| TISI | TEAM INC | 24.25 | 45.87% | 118.47% |
Free Download for Readers
As a bonus to our Free Weekly Newsletter subscribers,
we are offering a FREE DOWNLOAD of one of our Stock Reports
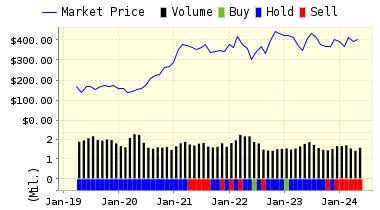
John Deere Company (DE) is an American corporation that manufactures agricultural, construction, and forestry machinery, diesel engines, drivetrains used in heavy equipment, and lawn care equipment. John Deere has developed a strategy to grow and sustain its successful global business. John Deere has capitalized on the opportunities presented by increasing population, prosperity, and urbanization. Today, broad trends based on population and income growth, especially in developing nations, are driving agricultural output and infrastructure investment. Further, technological advances and agricultural mechanization are expanding existing markets and opening new ones.
VALUENGINE RECOMMENDATION: ValuEngine continues its HOLD recommendation on DEERE & CO for 2018-08-16. Based on the information we have gathered and our resulting research, we feel that DEERE & CO has the probability to ROUGHLY MATCH average market performance for the next year. The company exhibits ATTRACTIVE Company Size but UNATTRACTIVE Book Market Ratio.
You can download a free copy of detailed report on John Deere Company (DE) from the link below.
Read our Complete Rating and Forecast Report HERE.
ValuEngine Forecast |
||
Target Price* |
Expected Return |
|
|---|---|---|
1-Month |
136.93 | -0.31% |
3-Month |
134.75 | -1.89% |
6-Month |
132.88 | -3.26% |
1-Year |
132.30 | -3.67% |
2-Year |
129.89 | -5.43% |
3-Year |
131.60 | -4.19% |
Valuation & Rankings |
|||
Valuation |
9.28% undervalued | Valuation Rank(?) | |
1-M Forecast Return |
-0.31% | 1-M Forecast Return Rank | |
12-M Return |
8.47% | Momentum Rank(?) | |
Sharpe Ratio |
0.56 | Sharpe Ratio Rank(?) | |
5-Y Avg Annual Return |
11.11% | 5-Y Avg Annual Rtn Rank | |
Volatility |
19.82% | Volatility Rank(?) | |
Expected EPS Growth |
25.26% | EPS Growth Rank(?) | |
Market Cap (billions) |
46.63 | Size Rank | |
Trailing P/E Ratio |
15.63 | Trailing P/E Rank(?) | |
Forward P/E Ratio |
12.48 | Forward P/E Ratio Rank | |
PEG Ratio |
0.62 | PEG Ratio Rank | |
Price/Sales |
1.39 | Price/Sales Rank(?) | |
Market/Book |
8.42 | Market/Book Rank(?) | |
Beta |
0.89 | Beta Rank | |
Alpha |
0.01 | Alpha Rank | |
Contact ValuEngine at (321) 325-0519 or support@valuengine.com
Visit www.ValuEngine.com for more information
Contact ValuEngine Capital at info@valuenginecapital.com
Visit www.ValuEngineCapital.com for more information
Steve Hach
Senior Editor
ValuEngine.com
