
January 5, 2018
This week, we provide top-five ranked VE data for our Construction Sector stocks. We take a look at our latest data on Intel $INTC and provide a free download link for our stock report on the company. Because overvaluation has crept up again, we now have another Valuation Watch. VALUATION WATCH: Overvalued
stocks now make up 61.23% of our stocks assigned a valuation and 23.64% of
those equities are calculated to be overvalued by 20% or more.
Because overvaluation has once again increased above 60%, we have re-insitituted a Valuation Watch.
Fifteen sectors are calculated to be overvalued.
ValuEngine Market Overview
ValuEngine Sector Overview
|
|||||||||||||||||||||||||||||||||||||||||||||||||||||||||||||||||||||||||||||||||||||||||||||||||||||||||||||||||||||||||||||||||||||||||||||||||||||||||||||||||||||||||||||||||||||||||||||||||||||||||||||||||||||||||||||||||||||||||||||||||||||||||||||||||||||||||||||||||||||||||||||||||||||||||||||||||||||||||||||||||||||||||||||||||||||||||||||||||||||||||||||||||||

Ticker |
Name |
Mkt Price |
Valuation (%) |
Last 12-M Return (%) |
OSB |
NORBORD INC |
35.14 |
N/A |
39.06% |
MHO |
M/I HOMES INC |
36.46 |
24.10% |
39.32% |
ACM |
AECOM |
38.95 |
17.95% |
1.51% |
CX |
CEMEX SA ADR |
7.95 |
N/A |
3.87% |
NWHM |
NEW HOME CO LLC |
13.06 |
12.36% |
10.49% |
Top-Five Construction Stocks--Momentum
Ticker |
Name |
Mkt Price |
Valuation (%) |
Last 12-M Return (%) |
BLD |
TOPBUILD CORP |
76.12 |
24.66% |
102.77% |
KBH |
KB HOME |
33.14 |
33.18% |
95.40% |
STRL |
STERLING CONSTR |
15.76 |
40.53% |
87.40% |
DHI |
D R HORTON INC |
52.07 |
40.02% |
84.45% |
OC |
OWENS CORNING |
93.65 |
19.57% |
80.62% |
Top-Five Construction Stocks--Composite Score
Ticker |
Name |
Mkt Price |
Valuation (%) |
Last 12-M Return (%) |
LPX |
LOUISIANA PAC |
27.87 |
7.50% |
40.47% |
PHM |
PULTE GROUP ONC |
33.83 |
22.86% |
78.15% |
URI |
UTD RENTALS INC |
172 |
18.94% |
56.55% |
MDC |
MDC HLDGS |
33.89 |
11.29% |
37.18% |
BZH |
BEAZER HOMES |
20.1 |
0.30% |
47.25% |
Top-Five Construction Stocks--Most Overvalued
Ticker |
Name |
Mkt Price |
Valuation (%) |
Last 12-M Return (%) |
CCS |
CENTURY COMMUNT |
34.05 |
44.03% |
59.86% |
CAA |
CALATLANTIC GRP |
59.78 |
42.40% |
69.97% |
STRL |
STERLING CONSTR |
15.76 |
40.53% |
87.40% |
DHI |
D R HORTON INC |
52.07 |
40.02% |
84.45% |
SUM |
SUMMIT MATERLS |
31.69 |
36.12% |
29.83% |
Free Download for Readers
As a bonus to our Free Weekly Newsletter subscribers,
we are offering a FREE DOWNLOAD of one of our Stock Reports
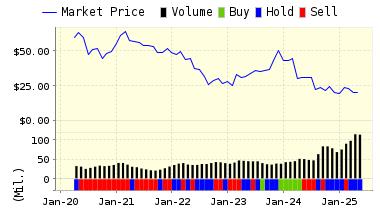
Intel Corporation (INTC) is one of the world's largest semiconductor chip maker. The Company develops advanced integrated digital technology products, primarily integrated circuits, for industries such as computing and communications. It also develops platforms, which it defines as integrated suites of digital computing technologies that are designed and configured to work together to provide an optimized user computing solution compared to components that are used separately. Intel designs and manufactures computing and communications components, such as microprocessors, chipsets, motherboards, and wireless and wired connectivity products, as well as platforms that incorporate these components. The Company sells its products primarily to original equipment manufacturers, original design manufacturers, PC and network communications products users, and other manufacturers of industrial and communications equipment. Intel Corporation is based in Santa Clara, California.
VALUENGINE RECOMMENDATION: ValuEngine continues its BUY recommendation on INTEL CORP for 2018-01-04. Based on the information we have gathered and our resulting research, we feel that INTEL CORP has the probability to OUTPERFORM average market performance for the next year. The company exhibits ATTRACTIVE Company Size and P/E Ratio.
You can download a free copy of detailed report on Intel Corporation (INTC) from the link below.
Read our Complete Rating and Forecast Report HERE.
ValuEngine Forecast |
||
Target Price* |
Expected Return |
|
|---|---|---|
1-Month |
44.68 | 0.56% |
3-Month |
44.42 | -0.01% |
6-Month |
44.55 | 0.27% |
1-Year |
47.41 | 6.71% |
2-Year |
46.34 | 4.31% |
3-Year |
47.24 | 6.33% |
Valuation & Rankings |
|||
Valuation |
3.90% overvalued | Valuation Rank(?) | |
1-M Forecast Return |
0.56% | 1-M Forecast Return Rank | |
12-M Return |
22.03% | Momentum Rank(?) | |
Sharpe Ratio |
0.79 | Sharpe Ratio Rank(?) | |
5-Y Avg Annual Return |
16.12% | 5-Y Avg Annual Rtn Rank | |
Volatility |
20.39% | Volatility Rank(?) | |
Expected EPS Growth |
0.31% | EPS Growth Rank(?) | |
Market Cap (billions) |
214.82 | Size Rank | |
Trailing P/E Ratio |
13.67 | Trailing P/E Rank(?) | |
Forward P/E Ratio |
13.63 | Forward P/E Ratio Rank | |
PEG Ratio |
44.43 | PEG Ratio Rank | |
Price/Sales |
3.46 | Price/Sales Rank(?) | |
Market/Book |
6.41 | Market/Book Rank(?) | |
Beta |
1.07 | Beta Rank | |
Alpha |
0.05 | Alpha Rank | |
Contact ValuEngine at (800) 381-5576 or support@valuengine.com
Visit www.ValuEngine.com for more information
Contact ValuEngine Capital at info@valuenginecapital.com
Visit www.ValuEngineCapital.com for more information

If you no longer wish to receive this free newsletter, CLICK HERE to unsubscribe
