
December 8, 2017
This week, we provide top-five ranked VE data for our Autos/Trucks/Tires Sector stocks. We take a look at our latest data on Best Buy $BBY and provide a free download link for our stock report on the company. We have rescinded our latest Valuation Watch.
ValuEngine Market Overview
ValuEngine Sector Overview
|
|||||||||||||||||||||||||||||||||||||||||||||||||||||||||||||||||||||||||||||||||||||||||||||||||||||||||||||||||||||||||||||||||||||||||||||||||||||||||||||||||||||||||||||||||||||||||||||||||||||||||||||||||||||||||||||||||||||||||||||||||||||||||||||||||||||||||||||||||||||||||||||||||||||||||||||||||||||||||||||||||||||||||||||||||||||||||||||||||||||||||||||||||||

Ticker |
Name |
Mkt Price |
Valuation (%) |
Last 12-M Return (%) |
GM |
GENERAL MOTORS |
42.02 |
11.80% |
15.76% |
CPS |
COOPER-STANDARD |
117.4 |
16.92% |
17.35% |
GT |
GOODYEAR TIRE |
31.32 |
15.56% |
-0.45% |
WNC |
WABASH NATIONAL |
20.42 |
28.97% |
39.01% |
ADNT |
ADIENT PLC |
79.14 |
N/A |
38.48% |
Top-Five Autos/Trucks/Tires Stocks--Momentum
Ticker |
Name |
Mkt Price |
Valuation (%) |
Last 12-M Return (%) |
FCAU |
FIAT CHRYSLER |
17.1 |
N/A |
101.89% |
CVGI |
COMML VEHICLE |
10.97 |
-5.38% |
99.45% |
MTOR |
MERITOR INC |
23.44 |
14.21% |
79.62% |
SPAR |
SPARTAN MOTORS |
15.85 |
51.22% |
79.10% |
SORL |
SORL AUTO PARTS |
6.97 |
-3.89% |
77.35% |
Top-Five Autos/Trucks/Tires Stocks--Composite Score
Ticker |
Name |
Mkt Price |
Valuation (%) |
Last 12-M Return (%) |
MGA |
MAGNA INTL CL A |
55.65 |
1.08% |
21.11% |
HMC |
HONDA MOTOR |
33.35 |
-5.40% |
11.09% |
LEA |
LEAR CORPORATN |
175.93 |
9.62% |
28.79% |
DAN |
DANA INC |
31.87 |
7.58% |
63.86% |
GM |
GENERAL MOTORS |
42.02 |
11.80% |
15.76% |
Top-Five Autos/Trucks/Tires Stocks--Most Overvalued
Ticker |
Name |
Mkt Price |
Valuation (%) |
Last 12-M Return (%) |
SPAR |
SPARTAN MOTORS |
15.85 |
51.22% |
79.10% |
CNHI |
CNH INDUSTRIAL |
12.98 |
31.03% |
41.86% |
FOXF |
FOX FACTORY HLD |
39.55 |
29.55% |
49.53% |
NAV |
NAVISTAR INTL |
40.59 |
29.46% |
27.36% |
WNC |
WABASH NATIONAL |
20.42 |
28.97% |
39.01% |
Free Download for Readers
As a bonus to our Free Weekly Newsletter subscribers,
we are offering a FREE DOWNLOAD of one of our Stock Reports
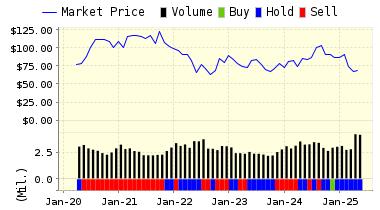
Best Buy Co., Inc. (BBY) operates as a retailer of technology products, services, and solutions in the United States, Canada, and Mexico. The company operates through two reportable segments, Domestic and International. Its stores provide consumer electronics, such as home theater, home automation, digital imaging, health and fitness, and portable audio products; computing and mobile phones, including computing and peripherals, networking, tablets, smart watches, and e-readers, as well as mobile phones comprising related mobile network carrier commissions; and entertainment products, such as gaming hardware and software, movie, music, technology toy, and other software products. The company’s stores also offer appliances, which include refrigeration and laundry appliances, dishwashers, ovens, coffee makers, blenders, etc.; and other products comprising snacks, beverages, and other sundry items. In addition, it provides services, such as consultation, design, delivery, installation, set-up, protection plan, repair, technical support, and educational services. The company offers its products through stores and Websites under the Best Buy, bestbuy.com, Best Buy Mobile, Best Buy Direct, Best Buy Express, Geek Squad, Magnolia Home Theater, Pacific Kitchen and Home, bestbuy.com.ca, and bestbuy.com.mx brand names, as well as through call centers. It has approximately 1,200 large-format and 400 small-format stores. The company was formerly known as Sound of Music, Inc. Best Buy Co., Inc. was founded in 1966 and is headquartered in Richfield, Minnesota.
VALUENGINE RECOMMENDATION: ValuEngine continues its BUY recommendation on Best Buy for 2017-12-07. Based on the information we have gathered and our resulting research, we feel that Best Buy has the probability to OUTPERFORM average market performance for the next year. The company exhibits ATTRACTIVE Company Size and Sharpe Ratio.
You can download a free copy of detailed report on Best Buy Co., Inc. (BBY) from the link below.
Read our Complete Rating and Forecast Report HERE.
ValuEngine Forecast |
||
Target Price* |
Expected Return |
|
|---|---|---|
1-Month |
61.97 | 0.78% |
3-Month |
62.16 | 1.08% |
6-Month |
63.51 | 3.29% |
1-Year |
67.23 | 9.33% |
2-Year |
70.49 | 14.64% |
3-Year |
74.02 | 20.37% |
Valuation & Rankings |
|||
Valuation |
13.33% overvalued | Valuation Rank(?) | |
1-M Forecast Return |
0.78% | 1-M Forecast Return Rank | |
12-M Return |
26.73% | Momentum Rank(?) | |
Sharpe Ratio |
0.75 | Sharpe Ratio Rank(?) | |
5-Y Avg Annual Return |
30.29% | 5-Y Avg Annual Rtn Rank | |
Volatility |
40.19% | Volatility Rank(?) | |
Expected EPS Growth |
4.80% | EPS Growth Rank(?) | |
Market Cap (billions) |
21.57 | Size Rank | |
Trailing P/E Ratio |
15.27 | Trailing P/E Rank(?) | |
Forward P/E Ratio |
14.57 | Forward P/E Ratio Rank | |
PEG Ratio |
3.18 | PEG Ratio Rank | |
Price/Sales |
0.54 | Price/Sales Rank(?) | |
Market/Book |
5.79 | Market/Book Rank(?) | |
Beta |
1.46 | Beta Rank | |
Alpha |
-0.00 | Alpha Rank | |
Contact ValuEngine at (800) 381-5576 or support@valuengine.com
Visit www.ValuEngine.com for more information
Contact ValuEngine Capital at info@valuenginecapital.com
Visit www.ValuEngineCapital.com for more information

If you no longer wish to receive this free newsletter, CLICK HERE to unsubscribe
