
May 11, 2018
This week, we provide top-five ranked VE data for our Oil and Energy Sector stocks. We take a look at our latest data on AT&T $T and provide a free download link for our stock report on the company.
|
||||||||||||||||||||||||||||||||||||||||||||||||||||||||||||||||||||||||||||||||||||||||||||||||||||||||||||||||||||||||||||||||||||||||||||||||||||||||||||||||||||||||||||||||||||||||||||||||||||||||||||||||||||||||||||||||||||||||||||||||||||||||||||||||||||||||||||||||||||||||||||||||||||||||||||||||||||||||||||||||||||||||||||||||||||||||||||||||||||||||||||||||||

Index
|
Week Open
|
Friday PM
|
Change
|
% Change
|
YTD
|
DJIA |
24317.66 |
24772.84 |
455.18 |
1.87% |
0.22% |
NASDAQ |
7241.82 |
7386.18 |
144.3602 |
1.99% |
6.99% |
RUSSELL 2000 |
1565.72 |
1603.84 |
38.12003 |
2.43% |
4.45% |
S&P 500 |
2680.34 |
2722.69 |
42.35 |
1.58% |
1.84% |
ValuEngine Market Overview
Summary of VE Stock Universe |
|
Stocks Undervalued |
47.63% |
Stocks Overvalued |
52.37% |
Stocks Undervalued by 20% |
17.42% |
Stocks Overvalued by 20% |
19.77% |
ValuEngine Sector Overview
Sector
|
Change
|
MTD
|
YTD
|
Valuation
|
Last 12-MReturn
|
P/E Ratio
|
-0.03% |
0.06% |
4.69% |
17.25% overvalued |
19.43% |
24.57 |
|
0.86% |
4.12% |
4.46% |
16.39% overvalued |
23.56% |
31.85 |
|
0.03% |
2.61% |
6.87% |
8.54% overvalued |
36.64% |
28.37 |
|
0.09% |
2.26% |
4.44% |
6.79% overvalued |
15.80% |
24.91 |
|
0.54% |
1.42% |
-1.37% |
4.82% overvalued |
14.53% |
26.60 |
|
-0.12% |
0.19% |
-2.46% |
4.36% overvalued |
10.79% |
24.31 |
|
0.36% |
0.86% |
-3.23% |
3.55% overvalued |
10.12% |
23.59 |
|
0.41% |
1.34% |
0.56% |
2.77% overvalued |
9.51% |
18.03 |
|
0.45% |
0.44% |
-3.77% |
2.15% overvalued |
11.19% |
25.77 |
|
0.67% |
1.25% |
-4.36% |
2.12% overvalued |
2.52% |
22.43 |
|
0.29% |
1.25% |
-1.48% |
0.98% overvalued |
13.88% |
24.40 |
|
0.43% |
3.04% |
-0.81% |
1.02% undervalued |
20.01% |
20.24 |
|
0.86% |
2.31% |
3.30% |
1.71% undervalued |
7.81% |
23.55 |
|
0.13% |
0.87% |
1.03% |
2.27% undervalued |
17.69% |
22.98 |
|
0.42% |
3.48% |
6.55% |
6.90% undervalued |
10.30% |
26.46 |
|
1.60% |
3.29% |
-4.92% |
7.22% undervalued |
10.69% |
13.12 |
Want to learn more about ValuEngine? Our methods? Our history?
Check out our video presentation HERE
Sector Talk--Oils and Energy
Below, we present the latest data on Oils and Energy
stocks from our Professional Stock Analysis Service. Top-
five lists are provided for each category. We applied some basic
liquidity criteria--share price greater than $3 and average daily
volume in excess of 100k shares.
Top-Five Oils and Energy Stocks--Short-Term Forecast Returns
Ticker |
Name |
Mkt Price |
Valuation (%) |
Last 12-M Return (%) |
RUN |
SUNRUN INC |
11.5 |
77.43% |
125.93% |
MDR |
MCDERMOTT INTL |
20.7 |
133.39% |
202.63% |
SEDG |
SOLAREDGE TECH |
64.85 |
47.87% |
268.47% |
CVRR |
CVR REFINING LP |
18.85 |
44.99% |
83.01% |
FSLR |
FIRST SOLAR INC |
73.01 |
56.05% |
99.64% |
Top-Five Oils and Energy Stocks--Momentum
Ticker |
Name |
Mkt Price |
Valuation (%) |
Last 12-M Return (%) |
IO |
ION GEOPHYSICAL |
27.35 |
-38.16% |
514.61% |
ENPH |
ENPHASE ENERGY |
5.21 |
-37.12% |
391.51% |
LGCY |
LEGACY RESERVES |
7.78 |
N/A |
279.51% |
SEDG |
SOLAREDGE TECH |
64.85 |
47.87% |
268.47% |
WTI |
W&T OFFSHORE |
7.46 |
-28.04% |
253.55% |
Top-Five Oils and Energy Stocks--Composite Score
Ticker |
Name |
Mkt Price |
Valuation (%) |
Last 12-M Return (%) |
HCC |
WARRIOR MET COA |
26.45 |
-18.17% |
53.42% |
WTI |
W&T OFFSHORE |
7.46 |
-28.04% |
253.55% |
CNQ |
CDN NTRL RSRCS |
36.23 |
-45.46% |
15.20% |
BTU |
PEABODY ENERGY |
38.06 |
-75.00% |
50.67% |
SRCI |
SRC ENERGY INC |
12.17 |
-2.74% |
61.62% |
Top-Five Oils and Energy Stocks--Most Overvalued
Ticker |
Name |
Mkt Price |
Valuation (%) |
Last 12-M Return (%) |
AMRS |
AMYRIS INC |
5.83 |
300.00% |
14.94% |
RIG |
TRANSOCEAN LTD |
13.42 |
220.75% |
20.14% |
DO |
DIAMOND OFFSHOR |
20.08 |
183.23% |
33.33% |
RDC |
ROWAN COS PLC |
16.21 |
138.75% |
16.45% |
MDR |
MCDERMOTT INTL |
20.7 |
133.39% |
202.63% |
Free Download for Readers
As a bonus to our Free Weekly Newsletter subscribers,
we are offering a FREE DOWNLOAD of one of our Stock Reports
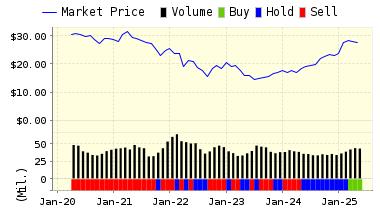
AT&T (T) provides communication, entertainment and internet services to consumers and businesses around the world. In the U.S., the company is the largest pay-TV provider and owns the second largest wireless network. AT&T provides connectivity, security, broadband, video and voice services under the AT&T, U-verse and DIRECTV brands.
VALUENGINE RECOMMENDATION: ValuEngine continues its SELL recommendation on AT&T INC for 2018-05-10. Based on the information we have gathered and our resulting research, we feel that AT&T INC has the probability to UNDERPERFORM average market performance for the next year. The company exhibits UNATTRACTIVE Momentum and Earnings Growth Rate.
You can download a free copy of detailed report on AT&T (T) from the link below.
Read our Complete Rating and Forecast Report HERE.
ValuEngine Forecast |
||
Target Price* |
Expected Return |
|
|---|---|---|
1-Month |
31.60 | -0.89% |
3-Month |
31.44 | -1.39% |
6-Month |
30.09 | -5.60% |
1-Year |
28.46 | -10.73% |
2-Year |
30.97 | -2.85% |
3-Year |
32.96 | 3.40% |
Valuation & Rankings |
|||
Valuation |
19.01% undervalued | Valuation Rank(?) | |
1-M Forecast Return |
-0.89% | 1-M Forecast Return Rank | |
12-M Return |
-17.09% | Momentum Rank(?) | |
Sharpe Ratio |
-0.16 | Sharpe Ratio Rank(?) | |
5-Y Avg Annual Return |
-2.72% | 5-Y Avg Annual Rtn Rank | |
Volatility |
16.65% | Volatility Rank(?) | |
Expected EPS Growth |
7.62% | EPS Growth Rank(?) | |
Market Cap (billions) |
165.36 | Size Rank | |
Trailing P/E Ratio |
9.98 | Trailing P/E Rank(?) | |
Forward P/E Ratio |
9.28 | Forward P/E Ratio Rank | |
PEG Ratio |
1.31 | PEG Ratio Rank | |
Price/Sales |
1.04 | Price/Sales Rank(?) | |
Market/Book |
1.12 | Market/Book Rank(?) | |
Beta |
0.38 | Beta Rank | |
Alpha |
-0.23 | Alpha Rank | |
Contact ValuEngine at (800) 381-5576 or support@valuengine.com
Visit www.ValuEngine.com for more information
Contact ValuEngine Capital at info@valuenginecapital.com
Visit www.ValuEngineCapital.com for more information
Steve Hach
Senior Editor
ValuEngine.com
