
August 3, 2018
EDITOR'S NOTE: We will be on a limited publication schedule later this month. Bulletins will be reduced the weeks of August 20-24 (we will publish M-W) and September 3-7 (we will publish W-F). There will be no bulletins the week of August 27-31. We will return to our normal publication schedule the week of September 10th.
|
||||||||||||||||||||||||||||||||||||||||||||||||||||||||||||||||||||||||||||||||||||||||||||||||||||||||||||||||||||||||||||||||||||||||||||||||||||||||||||||||||||||||||||||||||||||||||||||||||||||||||||||||||||||||||||||||||||||||||||||||||||||||||||||||||||||||||||||||||||||||||||||||||||||||||||||||||||||||||||||||||||||||||||||||||||||||||||||||||||||||||||||||||

Index
|
Week Open
|
Friday PM
|
Change
|
% Change
|
YTD
|
DJIA |
25439.32 |
25399.83 |
-39.49 |
-0.16% |
2.75% |
NASDAQ |
7735.27 |
7790.67 |
55.40 |
0.72% |
12.85% |
RUSSELL 2000 |
1663.39 |
1670.62 |
7.23 |
0.43% |
8.80% |
S&P 500 |
2842.35 |
2832.07 |
-10.28 |
-0.36% |
5.93% |
ValuEngine Market Overview
Summary of VE Stock Universe |
|
Stocks Undervalued |
48.5% |
Stocks Overvalued |
51.5% |
Stocks Undervalued by 20% |
19.01% |
Stocks Overvalued by 20% |
20.07% |
ValuEngine Sector Overview
Sector
|
Change
|
MTD
|
YTD
|
Valuation
|
Last 12-MReturn
|
P/E Ratio
|
0.59% |
1.04% |
6.67% |
14.76% overvalued |
24.56% |
31.59 |
|
-0.31% |
-0.63% |
7.76% |
13.11% overvalued |
17.84% |
26.49 |
|
-0.03% |
0.43% |
14.68% |
10.83% overvalued |
42.00% |
29.86 |
|
0.15% |
-0.73% |
-2.09% |
7.42% overvalued |
6.83% |
21.65 |
|
0.66% |
0.06% |
4.98% |
7.07% overvalued |
23.53% |
24.60 |
|
-0.05% |
0.02% |
7.07% |
6.36% overvalued |
20.19% |
25.53 |
|
0.03% |
0.32% |
3.44% |
5.22% overvalued |
16.39% |
26.03 |
|
0.50% |
0.14% |
-4.89% |
3.30% overvalued |
-3.85% |
20.34 |
|
-0.05% |
0.04% |
2.41% |
3.16% overvalued |
7.17% |
17.88 |
|
0.58% |
-0.12% |
-0.45% |
2.81% overvalued |
10.20% |
24.72 |
|
0.33% |
0.26% |
-0.11% |
0.81% overvalued |
16.93% |
19.50 |
|
-0.25% |
-0.46% |
2.90% |
0.04% undervalued |
14.54% |
23.88 |
|
0.48% |
-0.32% |
-3.48% |
0.88% undervalued |
3.37% |
13.17 |
|
-0.36% |
-1.35% |
0.47% |
4.76% undervalued |
13.29% |
21.81 |
|
-0.46% |
-0.77% |
4.22% |
7.89% undervalued |
1.88% |
21.09 |
|
0.32% |
0.09% |
9.37% |
10.21% undervalued |
18.74% |
24.42 |
Want to learn more about ValuEngine? Our methods? Our history?
Check out our video presentation HERE
Sector Talk--Oils/Energy
Below, we present the latest data on Oils/Energy
stocks from our Professional Stock Analysis Service. Top-
five lists are provided for each category. We applied some basic
liquidity criteria--share price greater than $3 and average daily
volume in excess of 100k shares.
Top-Five Oils/Energy Stocks--Short-Term Forecast Returns
Ticker |
Name |
Mkt Price |
Valuation (%) |
Last 12-M Return (%) |
AMRS |
AMYRIS INC |
6.94 |
300.00% |
76.59% |
NE |
NOBLE CORP PLC |
5.85 |
300.00% |
46.62% |
DO |
DIAMOND OFFSHOR |
18.51 |
300.00% |
53.10% |
RIG |
TRANSOCEAN LTD |
12.81 |
77.24% |
48.44% |
CRC |
CA RESOURCES CP |
35.07 |
29.31% |
362.66% |
Top-Five Oils/Energy Stocks--Momentum
Ticker |
Name |
Mkt Price |
Valuation (%) |
Last 12-M Return (%) |
ENPH |
ENPHASE ENERGY |
5.695 |
-33.54% |
505.85% |
IO |
ION GEOPHYSICAL |
18.1 |
-57.82% |
409.86% |
CRC |
CA RESOURCES CP |
35.07 |
29.31% |
362.66% |
WTI |
W&T OFFSHORE |
7.12 |
-28.37% |
268.91% |
CVRR |
CVR REFINING LP |
21.75 |
36.13% |
177.07% |
Top-Five Oils/Energy Stocks--Composite Score
Ticker |
Name |
Mkt Price |
Valuation (%) |
Last 12-M Return (%) |
HFC |
HOLLYFRONTIER |
68.91 |
-10.15% |
126.01% |
PBR |
PETROBRAS-ADR C |
11.92 |
-8.80% |
32.30% |
CLR |
CONTL RESOURCES |
63.62 |
-7.94% |
94.26% |
DK |
DELEK US HLDGS |
51.11 |
-6.95% |
94.48% |
WLL |
WHITING PETROLM |
47.06 |
-56.31% |
132.97% |
Top-Five Oils/Energy Stocks--Most Overvalued
Ticker |
Name |
Mkt Price |
Valuation (%) |
Last 12-M Return (%) |
DO |
DIAMOND OFFSHOR |
18.51 |
300.00% |
53.10% |
NE |
NOBLE CORP PLC |
5.85 |
300.00% |
46.62% |
AMRS |
AMYRIS INC |
6.94 |
300.00% |
76.59% |
RDC |
ROWAN COS PLC |
13.66 |
102.67% |
20.46% |
BAS |
BASIC EGY SVCS |
7.56 |
89.32% |
-64.67% |
Free Download for Readers
As a bonus to our Free Weekly Newsletter subscribers,
we are offering a FREE DOWNLOAD of one of our Stock Reports
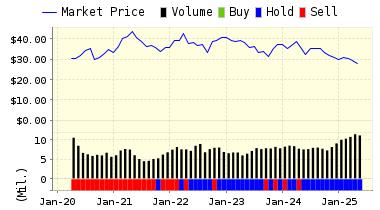
The Kraft Heinz Company (KHC) is a food and beverage company. The Company's brands include Kraft, Heinz, ABC, Capri Sun, Classico, Jell-O, Kool-Aid, Lunchables, Maxwell House, Ore-Ida, Oscar Mayer, Philadelphia, Planters, Plasmon, Quero, Weight Watchers Smart Ones and Velveeta. The Kraft Heinz Company formerly known as Kraft Foods Group, Inc., is based in PITTSBURGH, United States.
VALUENGINE RECOMMENDATION: ValuEngine continues its STRONG SELL recommendation on Kraft Heinz Company for 2018-08-02. Based on the information we have gathered and our resulting research, we feel that Kraft Heinz Company has the probability to UNDERPERFORM average market performance for the next year. The company exhibits UNATTRACTIVE Momentum and Earnings Growth Rate.
You can download a free copy of detailed report on The Kraft Heinz Company (KHC) from the link below.
Read our Complete Rating and Forecast Report HERE.
ValuEngine Forecast |
||
Target Price* |
Expected Return |
|
|---|---|---|
1-Month |
58.63 | -1.30% |
3-Month |
58.17 | -2.06% |
6-Month |
56.01 | -5.71% |
1-Year |
50.14 | -15.59% |
2-Year |
52.44 | -11.72% |
3-Year |
53.92 | -9.22% |
Valuation & Rankings |
|||
Valuation |
23.00% undervalued | Valuation Rank(?) | |
1-M Forecast Return |
-1.30% | 1-M Forecast Return Rank | |
12-M Return |
-31.62% | Momentum Rank(?) | |
Sharpe Ratio |
0.05 | Sharpe Ratio Rank(?) | |
5-Y Avg Annual Return |
1.26% | 5-Y Avg Annual Rtn Rank | |
Volatility |
23.31% | Volatility Rank(?) | |
Expected EPS Growth |
8.84% | EPS Growth Rank(?) | |
Market Cap (billions) |
35.18 | Size Rank | |
Trailing P/E Ratio |
16.67 | Trailing P/E Rank(?) | |
Forward P/E Ratio |
15.32 | Forward P/E Ratio Rank | |
PEG Ratio |
1.89 | PEG Ratio Rank | |
Price/Sales |
1.34 | Price/Sales Rank(?) | |
Market/Book |
0.53 | Market/Book Rank(?) | |
Beta |
0.58 | Beta Rank | |
Alpha |
-0.45 | Alpha Rank | |
Contact ValuEngine at (321) 325-0519 or support@valuengine.com
Visit www.ValuEngine.com for more information
Contact ValuEngine Capital at info@valuenginecapital.com
Visit www.ValuEngineCapital.com for more information
Steve Hach
Senior Editor
ValuEngine.com
