February 2, 2016
For today's bulletin, we present key metrics for the top picks in the S&P 500. Check out our latest SP500 top-ten stock list.
VALUATION WARNING: Overvalued stocks now make up 65.65% of our stocks assigned a valuation and 29.41% of those equities are calculated to be overvalued by 20% or more. Fourteen sectors are calculated to be overvalued.
If you cannot display this bulletin properly, GO HERE
Glass Houses
--Container Giant Owens-Illinois Debuts At Number One On ValuEngine SP500 Top-Stock List
ValuEngine tracks more than 7000 US equities, ADRs, and foreign stock which trade on US exchanges as well as @1000 Canadian equities. When EPS estimates are available for a given equity, our model calculates a level of mispricing or valuation percentage for that equity based on earnings estimates and what the stock should be worth if the market were totally rational and efficient--an academic exercise to be sure, but one which allows for useful comparisons between equities, sectors, and industries. Using our Valuation Model, we can currently assign a VE valuation calculation to more than 2800 stocks in our US Universe.
We also use trading data to provide forecast estimates for a variety of time horizons for almost ever equity in our database. Our Buy/Sell/Hold recommendations are based upon the 1-year forecast return figure. Using valuation and forecast figures, you can rank and rate our covered stocks against each other, to find out, in an objective and systematic way, the most attractive investment targets based on your own risk/reward parameters. We re-calculate the entire database every trading day, so you are assured that every proprietary valuation and forecast datapoint is as up-to-date as possible.
We can use our data to track individual stocks, industries, sectors, and indices. For today's bulletin, we present key metrics for the top picks in the S&P 500. The companies listed below represent the top-ten BUY/STRONG BUY stocks within the index. They are presented below according to their one-month forecast target prices.
This week, we saw a 40% turnover for our list since the last time we looked at the SP500 in December. Our new leader is Owens-Illinois (OI). Our last number one pick, Navient Corp, dropped to third. Other decliners include UNUM Group and Hewlett Packard Enterprise.
Our other newcomers are Principal Financial, Borg Warner, and Morgan Stanley. We also had three firms improve their positions this week--Lincoln National, HP Incorporated, and Discover Financial Services.
We have a top-ten list that is dominated by Finance Sector firms this time around. In addition, Discover, Principal Financial, Borg Warner and Morgan Stanley are BUY-rated companies. The remaining firms are all considered STRONG BUY stocks.
Ticker |
Company Name |
Market Price |
Valuation |
Last 12-M Retrn |
1-M Forecast Retn |
1-Yr Forecast Retn |
P/E Ratio |
Sector Name |
Dec. 29, 2016 |
OI |
OWENS-ILLINOIS |
19.83 |
-0.51% |
56.64% |
1.32% |
15.91% |
8.58 |
Industrial Products |
NAVI |
LNC |
LINCOLN NATL-IN |
68.92 |
11.13% |
75.68% |
1.25% |
15.02% |
10.66 |
Finance |
HPE |
NAVI |
NAVIENT CORP |
15 |
14.40% |
61.12% |
1.21% |
14.62% |
8.18 |
Finance |
LNC |
HPQ |
HP INC |
14.99 |
12.66% |
50.35% |
1.13% |
13.54% |
9.25 |
Computer and Technology |
UNM |
UNM |
UNUM GROUP |
45.77 |
16.07% |
60.65% |
1.06% |
12.73% |
11.67 |
Finance |
AMAT |
DFS |
DISCOVER FIN SV |
68.77 |
7.02% |
49.34% |
1.06% |
12.71% |
11.83 |
Finance |
R |
PFG |
PRINCIPAL FINL |
57.2 |
5.52% |
50.72% |
1.05% |
12.66% |
12.43 |
Finance |
URI |
BWA |
BORG WARNER INC |
41.03 |
-17.89% |
37.82% |
1.05% |
12.65% |
12.55 |
Auto-Tires-Trucks |
DFS |
MS |
MORGAN STANLEY |
42.7 |
8.50% |
66.08% |
1.04% |
12.44% |
14.12 |
Finance |
HPQ |
HPE |
HEWLETT PKD ENT |
22.59 |
N/A |
63.81% |
1.02% |
12.23% |
11.53 |
Computer and Technology |
TWX |
NOTE: New stocks are in BOLD, old stocks that have moved up the list are in GREEN, old stocks that have declined in position are in RED, and stocks which have retained their position are in CAPS.
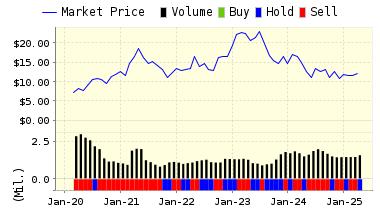
Below is today's data on our SP500 top-ten leader, Owens-Illinois (OI):
Owens-Illinois, Inc. manufactures and sells glass container products to food and beverage manufacturers primarily in Europe, North America, South America, and the Asia Pacific. The Company produces glass containers for malt beverages, including beer and ready-to-drink low-alcohol refreshers, liquor, wine, food, tea, juice and pharmaceuticals. It also produces glass containers for soft drinks and other non-alcoholic beverages. Owens-Illinois, Inc. is headquartered in Perrysburg, Ohio.
ValuEngine continues its STRONG BUY recommendation on OWENS-ILLINOIS for 2017-02-01. Based on the information we have gathered and our resulting research, we feel that OWENS-ILLINOIS has the probability to OUTPERFORM average market performance for the next year. The company exhibits ATTRACTIVE P/E Ratio and Price Sales Ratio.
You can download a free copy of detailed report on Owens-Illinois (OI) from the link below.
ValuEngine Forecast |
| |
Target
Price* |
Expected
Return |
1-Month |
20.09 |
1.32% |
3-Month |
20.12 |
1.45% |
6-Month |
20.49 |
3.31% |
1-Year |
22.99 |
15.91% |
2-Year |
19.46 |
-1.86% |
3-Year |
18.44 |
-7.00% |
Valuation & Rankings |
Valuation |
0.51% undervalued |
|
 67 67 |
1-M Forecast Return |
1.32% |
1-M Forecast Return Rank |
100 |
12-M Return |
56.64% |
|
81 |
Sharpe Ratio |
-0.17 |
|
35 |
5-Y Avg Annual Return |
-4.82% |
5-Y Avg Annual Rtn Rank |
37 |
Volatility |
28.14% |
|
57 |
Expected EPS Growth |
9.52% |
|
37 |
Market Cap (billions) |
3.27 |
Size Rank |
78 |
Trailing P/E Ratio |
8.58 |
|
96 |
Forward P/E Ratio |
7.84 |
Forward P/E Ratio Rank |
93 |
PEG Ratio |
0.90 |
PEG Ratio Rank |
46 |
Price/Sales |
0.49 |
|
85 |
Market/Book |
6.35 |
|
21 |
Beta |
1.58 |
Beta Rank |
18 |
Alpha |
0.12 |
Alpha Rank |
67 |

DOWNLOAD A FREE SAMPLE OF OUR OWENS-ILLINOIS (OI) REPORT BY CLICKING HERE
ValuEngine Market Overview
Summary of VE Stock Universe |
Stocks Undervalued |
34.35% |
Stocks Overvalued |
65.65% |
Stocks Undervalued by 20% |
13.81% |
Stocks Overvalued by 20% |
29.41% |
ValuEngine Sector Overview
|
|
|
|
|
|
|
|
0.39% |
0.44% |
3.34% |
22.20% overvalued |
34.79% |
24.73 |
|
0.07% |
0.11% |
2.99% |
16.59% overvalued |
27.85% |
19.80 |
|
-0.02% |
0.01% |
1.58% |
14.56% overvalued |
23.35% |
18.06 |
|
0.04% |
0.15% |
4.61% |
13.04% overvalued |
25.38% |
29.88 |
|
-0.27% |
-0.23% |
1.09% |
12.11% overvalued |
17.06% |
23.62 |
|
-1.17% |
-1.11% |
1.06% |
11.75% overvalued |
18.59% |
22.62 |
|
-0.06% |
-0.02% |
2.41% |
11.62% overvalued |
27.93% |
20.03 |
|
0.16% |
0.21% |
2.77% |
10.13% overvalued |
43.80% |
28.70 |
|
0.34% |
0.39% |
2.17% |
8.86% overvalued |
38.79% |
14.79 |
|
-0.14% |
-0.09% |
4.67% |
8.33% overvalued |
28.66% |
19.86 |
|
-0.00% |
0.03% |
1.44% |
8.28% overvalued |
12.16% |
23.83 |
|
0.60% |
0.76% |
8.88% |
8.23% overvalued |
90.30% |
27.12 |
|
0.19% |
0.22% |
2.05% |
6.83% overvalued |
39.23% |
20.88 |
|
-0.13% |
-0.08% |
1.53% |
4.48% overvalued |
23.00% |
24.84 |
|
-0.28% |
-0.22% |
-2.05% |
0.64% undervalued |
8.83% |
22.90 |
|
0.46% |
0.57% |
4.95% |
2.62% undervalued |
5.45% |
27.51 |
ValuEngine.com is an independent research provider, producing buy/hold/sell recommendations, target price, and valuations on over 7,000 US and Canadian equities every trading day.
Visit www.ValuEngine.com for more information

|


