January 12, 2016
VALUATION WARNING: Overvalued stocks now make up 65.77% of our stocks assigned a valuation and 30.95% of those equities are calculated to be overvalued by 20% or more. Fifteen sectors are calculated to be overvalued.
If you cannot display this bulletin properly, GO HERE
Indexing
--ValuEngine: JPMorgan Chase Dethrones IBM As Dow Leader
ValuEngine tracks more than 7000 US equities, ADRs, and foreign stock which trade on US exchanges as well as @1000 Canadian equities. When EPS estimates are available for a given equity, our model calculates a level of mispricing or valuation percentage for that equity based on earnings estimates and what the stock should be worth if the market were totally rational and efficient--an academic exercise to be sure, but one which allows for useful comparisons between equities, sectors, and industries. Using our Valuation Model, we can currently assign a VE valuation calculation to more than 2800 stocks in our US Universe.
We also use trading data to provide forecast estimates for a variety of time horizons for almost ever equity in our database. Our Buy/Sell/Hold recommendations are based upon the 1-year forecast return figure. Using valuation and forecast figures, you can rank and rate our covered stocks against each other, to find out, in an objective and systematic way, the most attractive investment targets based on your own risk/reward parameters. We re-calculate the entire database every trading day, so you are assured that every proprietary valuation and forecast datapoint is as up-to-date as possible.
We can use our data to track individual stocks, industries, sectors, and indices. For today's bulletin, we present key metrics for the top picks in the Dow Jones Industrials. The companies listed below represent the top stocks within the index. They are presented below according to their one-month forecast gain.
Since we last presented the top Dow picks on December 15th, nothing much has changed in terms of list components. We only have a 20% turnover this month as newcomers Intel and Apple replace Wal-Mart and Merck.
IBM could not retain its top spot and falls two spots to third as JPMorgan Chase is our new leader. Cisco Systems, Verizon, and prior, long-time leader Traveler's also declined.
Moving up this month--in addition to the aforementioned JPM, are American Express and United Health
Currently we have no STRONG BUY-rated stocks in the DOW right now. Our entire top-ten list consists of BUY-rated equities.
Ticker |
Company Name |
Market Price |
Valuation |
Last 12-M Retrn |
1-M Forecast Retn |
1-Yr Forecast Retn |
P/E Ratio |
Sector Name |
Dec. 15th, 2016 |
JPM |
JPMORGAN CHASE |
87.08 |
32.17% |
48.02% |
0.88% |
10.52% |
14.76 |
Finance |
IBM |
GS |
GOLDMAN SACHS |
245.76 |
35.70% |
48.29% |
0.85% |
10.25% |
15.35 |
Finance |
GS |
IBM |
INTL BUS MACH |
167.75 |
10.48% |
25.91% |
0.77% |
9.25% |
12.43 |
Computer and Technology |
JPM |
AXP |
AMER EXPRESS CO |
76.91 |
3.41% |
20.08% |
0.62% |
7.40% |
13.31 |
Finance |
CSCO |
UNH |
UNITEDHEALTH GP |
161.89 |
12.18% |
47.74% |
0.56% |
6.75% |
20.21 |
Medical |
VZ |
AAPL |
APPLE INC |
119.75 |
11.37% |
21.54% |
0.56% |
6.68% |
14.59 |
Computer and Technology |
AXP |
CSCO |
CISCO SYSTEMS |
30.15 |
5.78% |
19.31% |
0.53% |
6.41% |
14.09 |
Computer and Technology |
UNH |
VZ |
VERIZON COMM |
52.46 |
3.75% |
16.35% |
0.51% |
6.12% |
13.45 |
Utilities |
WMT |
INTC |
INTEL CORP |
36.95 |
8.48% |
15.25% |
0.47% |
5.58% |
13.79 |
Computer and Technology |
TRV |
TRV |
TRAVELERS COS |
117.65 |
13.07% |
10.17% |
0.44% |
5.30% |
12.07 |
Finance |
MRK |
NOTE: New stocks are in BOLD, old stocks that have moved up the list are in GREEN, old stocks that have declined in position are in RED, and stocks which have retained their position are in CAPS.
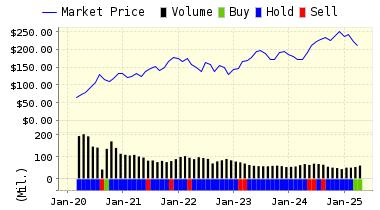
Below is today's data on Apple (AAPL):
Apple Inc. is engaged in designing, manufacturing and marketing mobile communication and media devices, personal computers, and portable digital music players. The Company's products and services include iPhone, iPad, Mac, iPod, Apple TV, a portfolio of consumer and professional software applications, the iOS and Mac OS X operating systems, iCloud, and a range of accessory, service and support offerings. It sells its products worldwide through its online stores, its retail stores, its direct sales force, third-party wholesalers, and resellers. Apple Inc. is headquartered in Cupertino, California.
VALUENGINE RECOMMENDATION: ValuEngine continues its BUY recommendation on APPLE INC for 2017-01-11. Based on the information we have gathered and our resulting research, we feel that APPLE INC has the probability to OUTPERFORM average market performance for the next year. The company exhibits ATTRACTIVE Company Size and P/E Ratio.
You can download a free copy of detailed report on American Express (AXP) from the link below.
ValuEngine Forecast |
| |
Target
Price* |
Expected
Return |
1-Month |
120.42 |
0.56% |
3-Month |
121.71 |
1.64% |
6-Month |
122.67 |
2.44% |
1-Year |
127.75 |
6.68% |
2-Year |
131.20 |
9.56% |
3-Year |
133.09 |
11.14% |
Valuation & Rankings |
Valuation |
11.37% overvalued |
|
 46 46 |
1-M Forecast Return |
0.56% |
1-M Forecast Return Rank |
87 |
12-M Return |
21.54% |
|
57 |
Sharpe Ratio |
0.55 |
|
80 |
5-Y Avg Annual Return |
13.88% |
5-Y Avg Annual Rtn Rank |
80 |
Volatility |
25.47% |
|
61 |
Expected EPS Growth |
9.74% |
|
38 |
Market Cap (billions) |
697.51 |
Size Rank |
100 |
Trailing P/E Ratio |
14.59 |
|
81 |
Forward P/E Ratio |
13.29 |
Forward P/E Ratio Rank |
70 |
PEG Ratio |
1.50 |
PEG Ratio Rank |
33 |
Price/Sales |
3.23 |
|
33 |
Market/Book |
5.83 |
|
23 |
Beta |
1.26 |
Beta Rank |
28 |
Alpha |
-0.02 |
Alpha Rank |
40 |

DOWNLOAD A FREE SAMPLE OF OUR REPORT ON APPLE (AAPL) BY CLICKING HERE
ValuEngine Market Overview
Summary of VE Stock Universe |
Stocks Undervalued |
34.23% |
Stocks Overvalued |
65.77% |
Stocks Undervalued by 20% |
14.27% |
Stocks Overvalued by 20% |
30.95% |
ValuEngine Sector Overview
|
|
|
|
|
|
|
|
0.23% |
1.82% |
1.82% |
18.78% overvalued |
23.11% |
20.05 |
|
0.38% |
1.75% |
1.75% |
18.65% overvalued |
33.27% |
24.83 |
|
1.03% |
2.97% |
2.97% |
18.36% overvalued |
46.18% |
26.79 |
|
0.12% |
1.31% |
1.31% |
16.00% overvalued |
21.16% |
18.14 |
|
-0.07% |
1.91% |
1.91% |
14.28% overvalued |
13.50% |
20.76 |
|
0.94% |
5.45% |
5.43% |
14.14% overvalued |
80.95% |
28.72 |
|
0.19% |
0.93% |
0.93% |
12.30% overvalued |
14.81% |
24.42 |
|
0.64% |
2.93% |
2.93% |
11.94% overvalued |
28.57% |
18.47 |
|
0.35% |
1.33% |
1.33% |
11.04% overvalued |
33.01% |
21.55 |
|
0.26% |
1.75% |
1.75% |
10.52% overvalued |
23.11% |
21.94 |
|
0.26% |
2.50% |
3.08% |
9.77% overvalued |
21.36% |
31.29 |
|
-0.00% |
2.15% |
2.15% |
8.62% overvalued |
34.87% |
14.92 |
|
-0.20% |
1.33% |
1.33% |
4.90% overvalued |
25.25% |
23.92 |
|
0.18% |
0.73% |
0.73% |
4.15% overvalued |
13.18% |
24.03 |
|
-0.34% |
-0.13% |
-0.13% |
0.92% overvalued |
10.17% |
23.16 |
|
-0.49% |
4.52% |
4.52% |
4.62% undervalued |
2.12% |
28.33 |
ValuEngine.com is an independent research provider, producing buy/hold/sell recommendations, target price, and valuations on over 7,000 US and Canadian equities every trading day.
Visit www.ValuEngine.com for more information

|


