December 29, 2016
VALUATION WARNING: Overvalued stocks now make up 64.98% of our stocks assigned a valuation and 33.551% of those equities are calculated to be overvalued by 20% or more. Fifteen sectors are calculated to be overvalued.
Editor's Note: Starting Wednesday, December 21st, we will be on a limited publication schedule. We will resume our normal full publication schedule on Tuesday, January 3rd.
If you cannot display this bulletin properly, GO HERE
HAPPY HOLIDAYS FROM VALUENGINE!!!
Top Swap
--Navient Dethrones HP Enterprise On ValuEngine SP500 Top Stock List
ValuEngine tracks more than 7000 US equities, ADRs, and foreign stock which trade on US exchanges as well as @1000 Canadian equities. When EPS estimates are available for a given equity, our model calculates a level of mispricing or valuation percentage for that equity based on earnings estimates and what the stock should be worth if the market were totally rational and efficient--an academic exercise to be sure, but one which allows for useful comparisons between equities, sectors, and industries. Using our Valuation Model, we can currently assign a VE valuation calculation to more than 2800 stocks in our US Universe.
We also use trading data to provide forecast estimates for a variety of time horizons for almost ever equity in our database. Our Buy/Sell/Hold recommendations are based upon the 1-year forecast return figure. Using valuation and forecast figures, you can rank and rate our covered stocks against each other, to find out, in an objective and systematic way, the most attractive investment targets based on your own risk/reward parameters. We re-calculate the entire database every trading day, so you are assured that every proprietary valuation and forecast datapoint is as up-to-date as possible.
We can use our data to track individual stocks, industries, sectors, and indices. For today's bulletin, we present key metrics for the top picks in the S&P 500. The companies listed below represent the top-ten BUY/STRONG BUY stocks within the index. They are presented below according to their one-month forecast target prices.
This week, we saw a 60% turnover for our list since the last time we looked at the SP500 at the beginning of December. We also have a new leader, Navient Corp., which swapped positions with--and dethroned-- Hewlett Packard Enterprise.
Besides Hewlett Packard Enterprise and Navient, we also see Applied Materials and Time Warner once again this month. Those two stocks declined a few positions each and Time Warner just managed to stay in the top-ten this time around.
Other newcomers include Lincoln National, UNUM Group, Ryder, United Rentals, Discover, and Hewlett Packard Inc.
While we have a tech-heavy list yet again, we also see that Consumer Discretionary and Finance firms are well-represented on our last Index top-ten list of 2016. In addition, the first three firms are ranked STRONG BUY-- along with Applied Materials. The remaining components on this list are BUY-rated.
Ticker |
Company Name |
Market Price |
Valuation |
Last 12-M Retrn |
1-M Forecast Retn |
1-Yr Forecast Retn |
P/E Ratio |
Sector Name |
Dec. 1, 2016 |
NAVI |
NAVIENT CORP |
16.45 |
23.51% |
43.54% |
1.17% |
14.02% |
8.88 |
Finance |
HPE |
HPE |
HEWLETT PKD ENT |
23.3 |
N/A |
52.99% |
1.13% |
13.61% |
12.01 |
Computer and Technology |
NAVI |
LNC |
LINCOLN NATL-IN |
66.6 |
16.00% |
31.62% |
1.02% |
12.25% |
10.62 |
Finance |
URBN |
UNM |
UNUM GROUP |
43.96 |
15.14% |
31.54% |
0.99% |
11.82% |
11.29 |
Finance |
AMAT |
AMAT |
APPLD MATLS INC |
32.9 |
7.20% |
73.16% |
0.98% |
11.73% |
17.38 |
Computer and Technology |
TWX |
R |
RYDER SYS |
75.18 |
9.69% |
33.23% |
0.96% |
11.50% |
12.88 |
Transportation |
SNI |
URI |
UTD RENTALS INC |
106.21 |
40.04% |
46.56% |
0.95% |
11.41% |
12.78 |
Construction |
LRCX |
DFS |
DISCOVER FIN SV |
71.91 |
11.77% |
32.31% |
0.94% |
11.33% |
12.63 |
Finance |
EXC |
HPQ |
HP INC |
14.94 |
40.65% |
28.46% |
0.94% |
11.26% |
9.26 |
Computer and Technology |
QCOM |
TWX |
TIME WARNER INC |
96.22 |
2.98% |
49.22% |
0.93% |
11.18% |
16.71 |
Consumer Discretionary |
BBY |
NOTE: New stocks are in BOLD, old stocks that have moved up the list are in GREEN, old stocks that have declined in position are in RED, and stocks which have retained their position are in CAPS.
Below is today's data on our SP500 top-ten leader, loan giant Navient (NAVI):
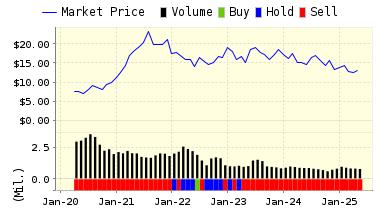
Navient Corporation offers a variety of loan management, servicing and asset recovery services to clients in higher education, and federal, state, and local governments. The Company operates in four segments: Consumer Lending, Business Services, FFELP Loans and Other. The Company acts as a servicer for Department of Education and FFELP loans as well as private student loans. Navient Corporation is based in United States.
ValuEngine continues its STRONG BUY recommendation on NAVIENT CORP for 2016-12-28. Based on the information we have gathered and our resulting research, we feel that NAVIENT CORP has the probability to OUTPERFORM average market performance for the next year. The company exhibits ATTRACTIVE P/E Ratio and Company Size.
You can download a free copy of detailed report on Navient (NAVI) from the link below.
ValuEngine Forecast |
| |
Target
Price* |
Expected
Return |
1-Month |
16.64 |
1.17% |
3-Month |
17.07 |
3.77% |
6-Month |
17.56 |
6.77% |
1-Year |
18.76 |
14.02% |
2-Year |
19.83 |
20.55% |
3-Year |
20.49 |
24.53% |
Valuation & Rankings |
Valuation |
23.51% overvalued |
|
 29 29 |
1-M Forecast Return |
1.17% |
1-M Forecast Return Rank |
99 |
12-M Return |
43.54% |
|
81 |
Sharpe Ratio |
0.08 |
|
59 |
5-Y Avg Annual Return |
3.47% |
5-Y Avg Annual Rtn Rank |
61 |
Volatility |
40.78% |
|
42 |
Expected EPS Growth |
3.06% |
|
27 |
Market Cap (billions) |
6.61 |
Size Rank |
86 |
Trailing P/E Ratio |
8.88 |
|
95 |
Forward P/E Ratio |
8.61 |
Forward P/E Ratio Rank |
90 |
PEG Ratio |
2.90 |
PEG Ratio Rank |
16 |
Price/Sales |
1.31 |
|
61 |
Market/Book |
2.16 |
|
50 |
Beta |
2.66 |
Beta Rank |
6 |
Alpha |
0.22 |
Alpha Rank |
82 |

DOWNLOAD A FREE SAMPLE OF OUR NAVIENT (NAVI) REPORT BY CLICKING HERE
ValuEngine Market Overview
Summary of VE Stock Universe |
Stocks Undervalued |
35.02% |
Stocks Overvalued |
64.98% |
Stocks Undervalued by 20% |
15.88% |
Stocks Overvalued by 20% |
33.55% |
ValuEngine Sector Overview
|
|
|
|
|
|
|
|
1.57% |
2.06% |
13.27% |
21.76% overvalued |
15.51% |
19.93 |
|
1.47% |
2.38% |
27.59% |
20.82% overvalued |
25.58% |
23.78 |
|
1.02% |
4.05% |
32.95% |
20.47% overvalued |
33.16% |
26.00 |
|
0.62% |
2.88% |
17.64% |
17.30% overvalued |
13.95% |
18.18 |
|
0.06% |
1.69% |
19.13% |
15.84% overvalued |
11.33% |
19.44 |
|
3.87% |
0.38% |
52.79% |
15.28% overvalued |
75.64% |
27.21 |
|
-0.07% |
-0.59% |
12.17% |
15.06% overvalued |
13.40% |
19.63 |
|
-0.04% |
1.81% |
22.66% |
11.81% overvalued |
12.32% |
29.64 |
|
0.94% |
1.71% |
37.31% |
11.77% overvalued |
27.68% |
20.50 |
|
1.28% |
1.79% |
23.12% |
11.71% overvalued |
10.13% |
24.02 |
|
-0.14% |
2.60% |
15.83% |
9.20% overvalued |
18.51% |
22.00 |
|
-0.76% |
0.77% |
11.63% |
7.89% overvalued |
19.82% |
14.78 |
|
0.74% |
2.53% |
10.23% |
6.12% overvalued |
9.69% |
24.09 |
|
0.30% |
2.03% |
12.11% |
5.93% overvalued |
14.69% |
23.49 |
|
1.50% |
0.08% |
3.50% |
5.79% overvalued |
9.01% |
23.35 |
|
-0.63% |
-0.29% |
-0.39% |
5.09% undervalued |
-10.21% |
27.85 |
ValuEngine.com is an independent research provider, producing buy/hold/sell recommendations, target price, and valuations on over 7,000 US and Canadian equities every trading day.
Visit www.ValuEngine.com for more information

|


