| June 15, 2016
 VALUATION WATCH: Overvalued stocks now make up 40% of our stocks assigned a valuation and 13.19% of those equities are calculated to be overvalued by 20% or more. Six sectors are calculated to be overvalued. If you cannot display this bulletin properly, GO HERE StaticValuations Remain In Normal Range (Barely)ValuEngine tracks       more than 7000 US equities, ADRs, and foreign stock   which trade on   US     exchanges as well as @1000 Canadian equities.  When EPS estimates are available for a   given   equity, our   model calculates a level of mispricing or valuation       percentage for   that equity based on earnings estimates and what the     stock should be   worth if   the market were totally rational and     efficient--an academic   exercise to   be sure, but one which allows for     useful comparisons   between equities,   sectors, and industries.   Using   our Valuation Model,   we can currently assign a VE valuation     calculation to more than 2800   stocks in our US Universe.  We combine all of the       equities with a valuation calculation to track  market valuation   figures       and use them as a metric for making calls about the   overall state   of     the market.  Two   factors can lower these figures-- a market pullback, or a significant rise in EPS estimates.    Vice-versa, a significant rally or reduction in EPS can raise the figure. Whenever we see overvaluation levels in     excess of @ 65% for the   overall universe and/or   27% for the   overvalued   by 20% or more   categories, we issue a valuation   warning.   We now calculate that  40% of the stocks we can assign a valuation are       overvalued and 13.19% of those stocks are overvalued by 20% or more. These numbers have declined-- slightly-- since we published our valuation study in May-- when the overvaluation was at 44.04%.
 Not much has changed since our last valuation study, except we now know for certain that the US presidential election will feature Trump vs. Clinton. But, that news creates  an uncertainty for sure, as Trump continues to make headlines almost every day--seemingly every time he opens his mouth. Clinton offers a continuation of Obama-era policies (which have generated booming markets, reduced deficits, and economic recovery. It's tough to tell what Trump offers, because he has made so many contradictory statements-- and his policies are oftne roundly panned by analysts and economists.
 Good news since our last report includes the recovery in the energy markets, with oil prices now above $50/barrel. 
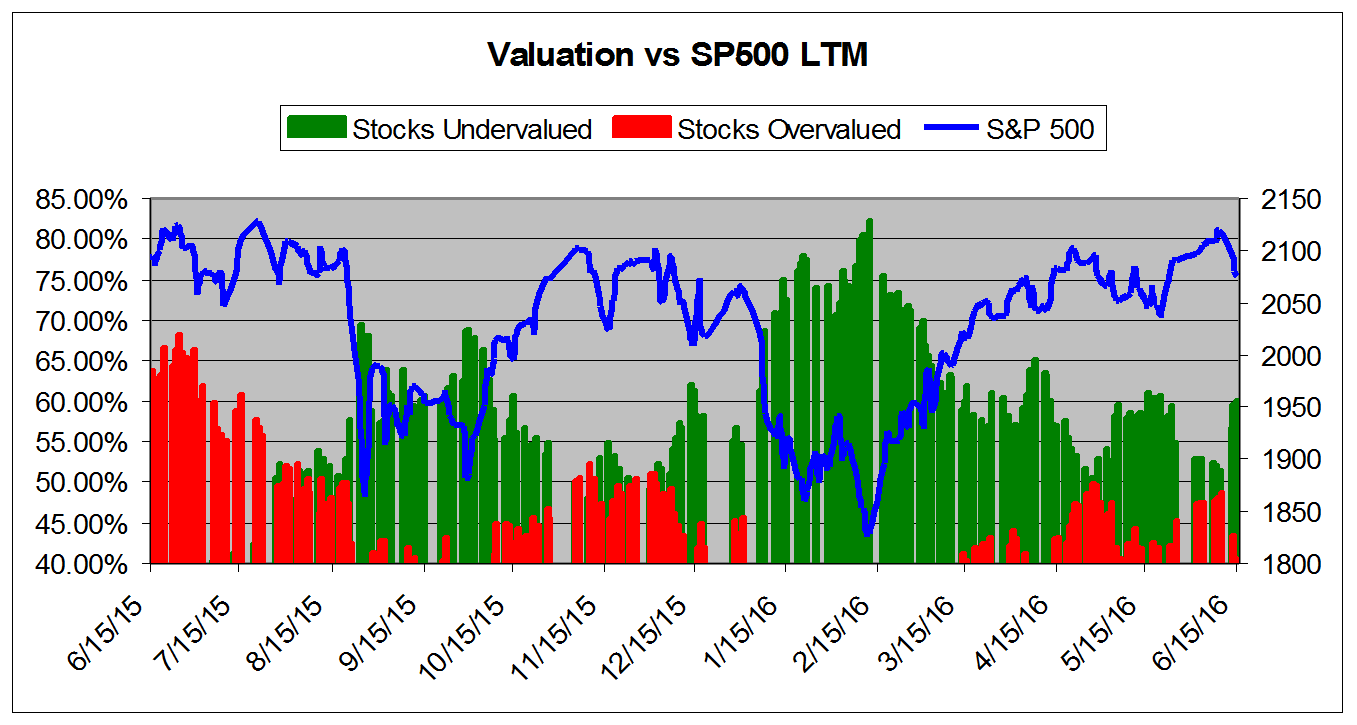
              Bad news includes a May jobs report that showed bad numbers and some questions about what many thought was a stronger, ongoing recovery.
 No one really expects a rate rise from today's Fed meeting, but the Central Bank is not giving any certainty to investors that they will refuse to hit the brakes on growth yet again.
                The last move still seems premature, as the labor market hasn't really benefitted from recovery in wages and inflation remains nowhere to be found.
 
 As always, the balancing act between the dual mandate of control inflation and foster full employment creates tension. we currently have low inflation and a job market which is near "full employment" according to past standards, but it sure doesn't seem that workers are benefitting from the recovery.
 Regardless, our valuation figures still show a "normal" market--albeit just barely.  The chart below tracks the valuation metrics from  June 2015. It shows levels in excess of 40%.
 
      This chart shows overall universe over valuation in excess of   40% vs the S&P 500 from June 2013 
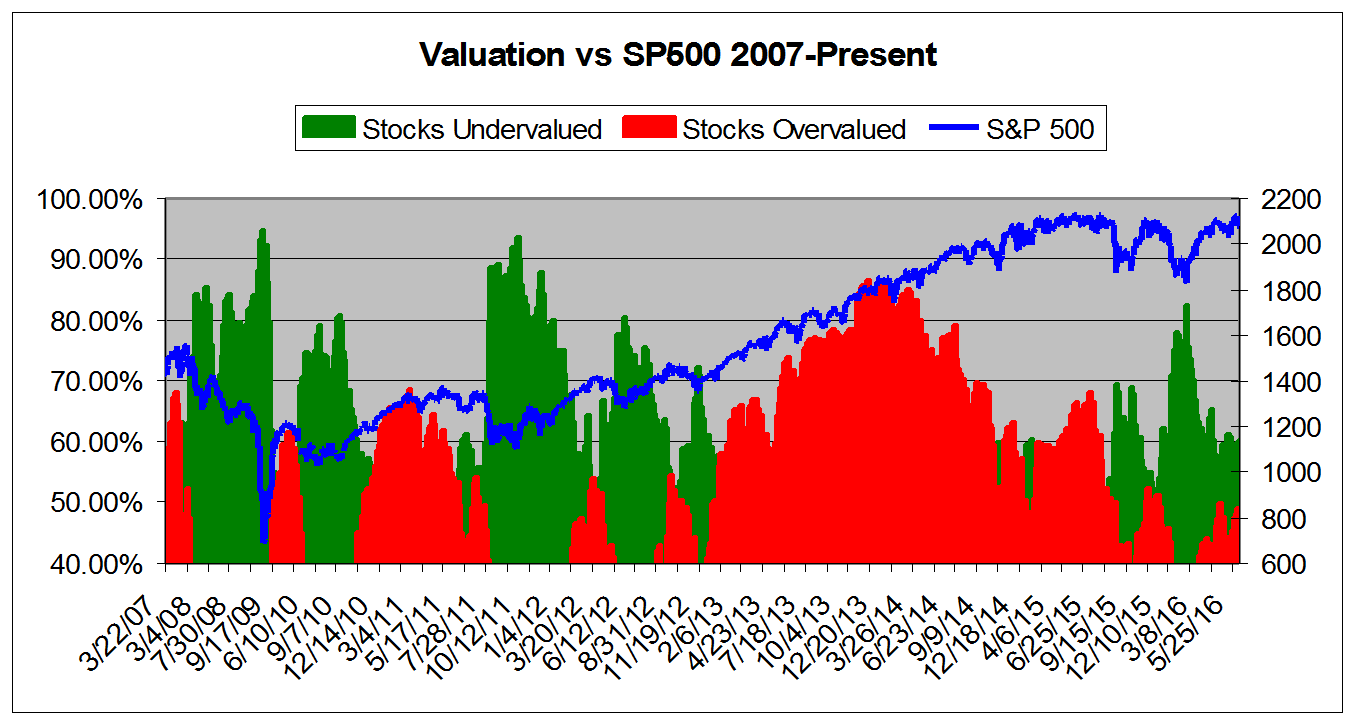
   This chart shows overall universe under and over valuation in excess   of 40% vs the S&P 500 from March 2007* 
 
                
                   *NOTE: Time Scale Compressed Prior to 2011.     ValuEngine Market Overview
                
                  | Summary of VE Stock Universe  |  
                  | Stocks Undervalued  | 59.92% |  
                  | Stocks Overvalued  | 40.08% |  
                  | Stocks Undervalued by 20%  | 26.62% |  
                  | Stocks Overvalued by 20%  | 13.19% |  ValuEngine Sector Overview
                
                  |  |  |  |  |  |  |  |  
                  |  | -1.60% | 2.37% | 31.43% | 6.94% overvalued | 18.39% | 28.15 |  
                  |  | -0.23% | -0.55% | 4.06% | 6.70% overvalued | 3.17% | 23.27 |  
                  |  | -0.45% | -0.39% | 5.71% | 5.31% overvalued | 3.76% | 23.31 |  
                  |  | -0.36% | -1.03% | 3.49% | 2.08% overvalued | -9.22% | 17.88 |  
                  |  | -0.84% | 0.39% | 10.51% | 1.46% overvalued | -31.80% | 22.97 |  
                  |  | -0.30% | -0.46% | 5.01% | 0.20% overvalued | -10.24% | 21.44 |  
                  |  | -0.65% | -2.71% | -4.55% | 1.55% undervalued | -5.78% | 18.52 |  
                  |  | -0.11% | -0.86% | 5.98% | 3.14% undervalued | -10.95% | 27.56 |  
                  |  | -0.26% | -0.66% | 10.40% | 4.16% undervalued | -10.98% | 22.60 |  
                  |  | -0.33% | -1.25% | 1.31% | 4.90% undervalued | -12.79% | 22.65 |  
                  |  | -0.86% | -2.23% | 0.20% | 5.33% undervalued | -6.01% | 15.66 |  
                  |  | -0.40% | -2.28% | 17.41% | 7.09% undervalued | -5.77% | 20.32 |  
                  |  | -0.77% | -1.31% | -6.61% | 9.77% undervalued | -23.22% | 26.66 |  
                  |  | -1.29% | -1.86% | 0.33% | 10.42% undervalued | -27.85% | 13.25 |  
                  |  | -0.29% | -3.68% | -3.98% | 11.67% undervalued | -18.59% | 11.66 |  
                  |  | -0.52% | -1.98% | -5.51% | 13.08% undervalued | -14.45% | 21.69 |    ValuEngine.com is an independent research provider, producing   buy/hold/sell recommendations, target price, and valuations on over   7,000 US and Canadian equities every trading day.  Visit www.ValuEngine.com for more information
  
 |