May 3, 2016
VALUATION WATCH: Overvalued stocks now make up 47.5% of our stocks assigned a valuation and 14.94% of those equities are calculated to be overvalued by 20% or more. Seven sectors are calculated to be overvalued.
If you cannot display this bulletin properly, GO HERE
April Showers May Bring New Car Drivers?
US Auto Sales Rebound In April
Preliminary sales data indicates that good times for major auto manufacturers--with a few exceptions--returned in April as analysts forecast a 5% sales increase for the overall industry over the past month.
“Following a disappointing March, we expect sales to get back on track in April with SAAR in the mid-17 million range,” Tim Fleming, analyst for Kelley Blue Book, said in an email. “Increased fleet sales and rising incentive spending among automakers remain the factors to watch, but retail demand appears to be holding steady, signaling the industry’s strong run isn’t over quite yet.”
Fiat/Chrysler posted a 4.6% gain,
Nissan posted a 13% increase, Honda sales were up 12%, Toyota had a 4.8% pick up, and Ford saw a 4.5% leap in April sales.
On the other hand, Volkswagen is in trouble in the US due to the continued fallout from their emissions-cheating scandal. GM once again lagged their competitors with a decline of 2.3% overall despite an increase in sales on the retail end for several of its brands. Fleet sales hampered them overall. And of course, trouble-wracked VW trailed all competitors with a decline of 2.6%.
Credit seems to be driving these strong sales figures, as low interest rates and favorable, long-term financing deals are causing customers to finance cars for even longer periods of time. Some consumers are now taking out seven-year car loans! We also see some warning signs from sub-prime car loans, with more delinquencies there.
When we query our systems for the auto industry today, we find the following data on the firms discussed above and a few other top companies. Complete data, including BUY/SELL/HOLD recommendations, are available at ValuEngine.com. Members can always screen for these stocks using our advanced screening page HERE.
Ticker |
Company Name |
Market Price |
Valuation |
Last 12-M Retrn |
1-M Forecast Retn |
1-Yr Forecast Retn |
P/E Ratio |
Country Code |
DDAIF |
DAIMLER AG |
70.55 |
-16.68% |
-27.51% |
0.07% |
0.86% |
7.95 |
DEU |
F |
FORD MOTOR CO |
13.62 |
-11.09% |
-13.85% |
0.38% |
4.55% |
6.16 |
USA |
FCAU |
FIAT CHRYSLER |
8.21 |
N/A |
-43.96% |
N/A |
N/A |
4.64 |
GBR |
GM |
GENERAL MOTORS |
31.75 |
-13.63% |
-10.36% |
0.54% |
6.48% |
5.76 |
USA |
HMC |
HONDA MOTOR |
27.11 |
-4.49% |
-20.78% |
0.05% |
0.57% |
10.99 |
JPN |
ISUZY |
ISUZU MOTORS |
10.52 |
N/A |
-21.14% |
N/A |
N/A |
9.91 |
JPN |
NSANY |
NISSAN ADR |
17.86 |
-13.46% |
-14.13% |
0.35% |
4.24% |
7.95 |
JPN |
TM |
TOYOTA MOTOR CP |
102.47 |
-16.03% |
-26.79% |
0.06% |
0.73% |
8.73 |
JPN |
TSLA |
TESLA MOTORS |
241.8 |
17.24% |
6.98% |
-0.08% |
-1.00% |
N/A |
USA |
VLKAY |
VOLKSWAGEN-ADR |
31.72 |
N/A |
-36.88% |
N/A |
N/A |
7.13 |
DEU |
Here Is complete data on one of our top Auto stocks:
General Motors Company (GM) is engaged in the designing, manufacturing and retailing of vehicles globally including passenger cars, crossover vehicles, and light trucks, sport utility vehicles, vans and other vehicles. Its business is organized into three geographically-based segments- General Motors North America (GMNA), General Motors International Operations (GMIO) and General Motors Europe (GME). General Motors Company is headquartered in Detroit, Michigan, the United States of America.
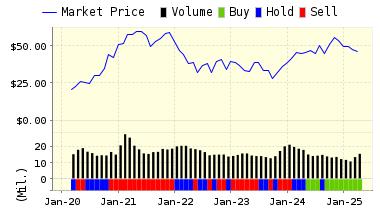
ValuEngine continues its BUY recommendation on GENERAL MOTORS for 2016-05-02. Based on the information we have gathered and our resulting research, we feel that GENERAL MOTORS has the probability to OUTPERFORM average market performance for the next year. The company exhibits ATTRACTIVE Company Size and P/E Ratio.
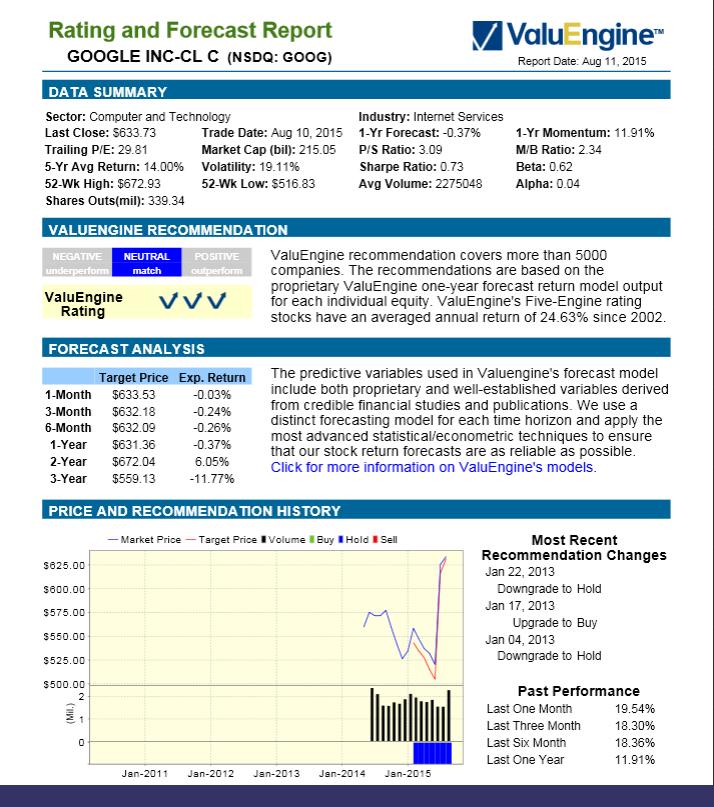
You can download a free copy of detailed report on General Motors from the link below.

ValuEngine Forecast |
| |
Target
Price* |
Expected
Return |
1-Month |
31.92 |
0.54% |
3-Month |
32.15 |
1.27% |
6-Month |
32.40 |
2.05% |
1-Year |
33.81 |
6.48% |
2-Year |
32.50 |
2.37% |
3-Year |
28.96 |
-8.79% |
Valuation & Rankings |
Valuation |
13.63% undervalued |
|
 71 71 |
1-M Forecast Return |
0.54% |
1-M Forecast Return Rank |
 86 86 |
12-M Return |
-10.36% |
|
 49 49 |
Sharpe Ratio |
-0.01 |
|
 55 55 |
5-Y Avg Annual Return |
-0.18% |
5-Y Avg Annual Rtn Rank |
 55 55 |
Volatility |
29.66% |
|
 58 58 |
Expected EPS Growth |
2.42% |
|
 27 27 |
Market Cap (billions) |
51.01 |
Size Rank |
 99 99 |
Trailing P/E Ratio |
5.76 |
|
 98 98 |
Forward P/E Ratio |
5.62 |
Forward P/E Ratio Rank |
 96 96 |
PEG Ratio |
2.38 |
PEG Ratio Rank |
 18 18 |
Price/Sales |
0.33 |
|
 88 88 |
Market/Book |
1.44 |
|
 62 62 |
Beta |
1.69 |
Beta Rank |
 17 17 |
Alpha |
-0.08 |
Alpha Rank |
 45 45 |

DOWNLOAD A FREE SAMPLE OF OUR GENERAL MOTORS (GM) REPORT BY CLICKING HERE
ValuEngine Market Overview
Summary of VE Stock Universe |
Stocks Undervalued |
52.5% |
Stocks Overvalued |
47.5% |
Stocks Undervalued by 20% |
21.85% |
Stocks Overvalued by 20% |
14.94% |
ValuEngine Sector Overview
|
|
|
|
|
|
|
|
-0.49% |
-0.37% |
34.93% |
15.09% overvalued |
10.74% |
28.64 |
|
0.56% |
0.61% |
6.43% |
9.56% overvalued |
-1.58% |
23.77 |
|
0.17% |
0.25% |
7.57% |
9.51% overvalued |
-10.05% |
20.96 |
|
0.61% |
0.67% |
7.58% |
8.80% overvalued |
-1.18% |
24.62 |
|
0.81% |
0.83% |
6.50% |
4.70% overvalued |
-3.62% |
20.59 |
|
-1.24% |
-1.12% |
11.33% |
4.00% overvalued |
-36.24% |
23.21 |
|
0.63% |
0.81% |
-1.48% |
2.03% overvalued |
-5.96% |
18.03 |
|
0.37% |
0.42% |
20.53% |
0.93% undervalued |
-3.13% |
21.31 |
|
0.36% |
0.40% |
1.53% |
1.85% undervalued |
-5.11% |
15.74 |
|
0.13% |
0.23% |
6.19% |
2.41% undervalued |
-8.36% |
26.58 |
|
0.19% |
0.28% |
8.68% |
2.62% undervalued |
-9.05% |
21.97 |
|
0.53% |
0.58% |
2.69% |
2.69% undervalued |
-9.15% |
23.80 |
|
-0.02% |
0.11% |
-3.52% |
6.33% undervalued |
-18.56% |
26.31 |
|
0.30% |
0.38% |
0.25% |
8.26% undervalued |
-14.31% |
22.78 |
|
0.24% |
0.28% |
1.66% |
9.27% undervalued |
-15.26% |
12.85 |
|
-0.09% |
-0.01% |
4.87% |
9.83% undervalued |
-26.57% |
13.65 |
ValuEngine.com is an independent research provider, producing buy/hold/sell recommendations, target price, and valuations on over 7,000 US and Canadian equities every trading day.
Visit www.ValuEngine.com for more information

|


