October 20, 2015VALUATION WATCH: Overvalued stocks now make up 42.38% of our stocks assigned a valuation and 13.78% of those equities are calculated to be overvalued by 20% or more. Four sectors are calculated to be overvalued. Editor's Note: Due to travel from October 29th-November 3rd, our free newsletters will be on a reduced publication schedule. There will be no free weekly or daily newsletters. Normal publication schedules will resume November 4th. Car Crash
|
|||||||||||||||||||||||||||||||||||||||||||||||||||||||||||||||||||||||||||||||||||||||||||||||||||||||||||||||||||||||||||||||||||||||||||||||||||||||||||||||||||||||||||||||||||||||||||||||||||||||||||||||||||||||||||
ValuEngine Forecast |
||
Target Price* |
Expected Return |
|
|---|---|---|
1-Month |
226.17 | -0.85% |
3-Month |
227.99 | -0.05% |
6-Month |
233.48 | 2.36% |
1-Year |
204.92 | -10.16% |
2-Year |
277.71 | 21.75% |
3-Year |
282.05 | 23.65% |
Valuation & Rankings |
|||
Valuation |
35.03% overvalued |
Valuation Rank(?) |
|
1-M Forecast Return |
-0.85% |
1-M Forecast Return Rank |
|
12-M Return |
-1.03% |
Momentum Rank(?) |
|
Sharpe Ratio |
0.91 |
Sharpe Ratio Rank(?) |
|
5-Y Avg Annual Return |
49.99% |
5-Y Avg Annual Rtn Rank |
|
Volatility |
55.21% |
Volatility Rank(?) |
|
Expected EPS Growth |
188.93% |
EPS Growth Rank(?) |
|
Market Cap (billions) |
28.60 |
Size Rank |
|
Trailing P/E Ratio |
n/a |
Trailing P/E Rank(?) |
|
Forward P/E Ratio |
94.65 |
Forward P/E Ratio Rank |
|
PEG Ratio |
0.45 |
PEG Ratio Rank |
|
Price/Sales |
7.72 |
Price/Sales Rank(?) |
|
Market/Book |
39.95 |
Market/Book Rank(?) |
|
Beta |
0.85 |
Beta Rank |
|
Alpha |
0.05 |
Alpha Rank |
|
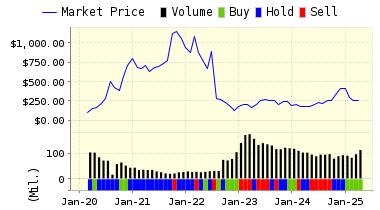
DOWNLOAD A FREE SAMPLE OF OUR TESLA (TSLA) REPORT BY CLICKING HERE
(LINK FIXED)
ValuEngine Market Overview
Summary of VE Stock Universe |
|
Stocks Undervalued |
57.62% |
Stocks Overvalued |
42.38% |
Stocks Undervalued by 20% |
24.03% |
Stocks Overvalued by 20% |
13.78% |
ValuEngine Sector Overview
Sector
|
Change
|
MTD
|
YTD
|
Valuation
|
Last 12-MReturn
|
P/E Ratio
|
0.55% |
5.00% |
0.46% |
5.91% overvalued |
3.61% |
23.37 |
|
0.64% |
4.96% |
-1.18% |
3.64% overvalued |
4.39% |
24.02 |
|
1.16% |
5.53% |
-9.46% |
1.17% overvalued |
-5.76% |
20.29 |
|
0.31% |
2.99% |
0.02% |
0.27% overvalued |
1.10% |
16.67 |
|
-0.40% |
5.13% |
-5.69% |
0.60% undervalued |
-3.34% |
22.32 |
|
0.17% |
5.00% |
2.96% |
1.82% undervalued |
4.03% |
26.32 |
|
0.34% |
4.22% |
-2.69% |
2.30% undervalued |
3.88% |
28.77 |
|
-0.13% |
4.23% |
-1.49% |
3.75% undervalued |
-3.89% |
17.64 |
|
0.83% |
3.17% |
-6.81% |
3.75% undervalued |
4.50% |
22.49 |
|
-0.77% |
1.61% |
2.51% |
3.88% undervalued |
6.78% |
29.43 |
|
0.98% |
6.95% |
-7.69% |
4.17% undervalued |
-8.14% |
18.10 |
|
1.04% |
4.83% |
-0.79% |
5.00% undervalued |
7.95% |
20.82 |
|
-0.13% |
13.79% |
-17.32% |
8.34% undervalued |
-37.50% |
26.09 |
|
-0.86% |
5.41% |
-12.29% |
8.60% undervalued |
-3.32% |
15.64 |
|
-0.58% |
8.47% |
-3.50% |
9.54% undervalued |
4.14% |
15.29 |
|
2.67% |
10.78% |
-14.02% |
12.01% undervalued |
-17.51% |
24.20 |
Visit www.ValuEngine.com for more information


